
The best street-level threat data coverage in the industry
of US territory
cities covered
data sources
A corridor with repeat robbery activity and a quiet street three blocks away can share the same city risk rating. Base Operations analyzes the immediate area around each address, compares candidates side by side, and shows you which one will actually cost more to secure.
Put candidate addresses on one scale before the lease is signed.
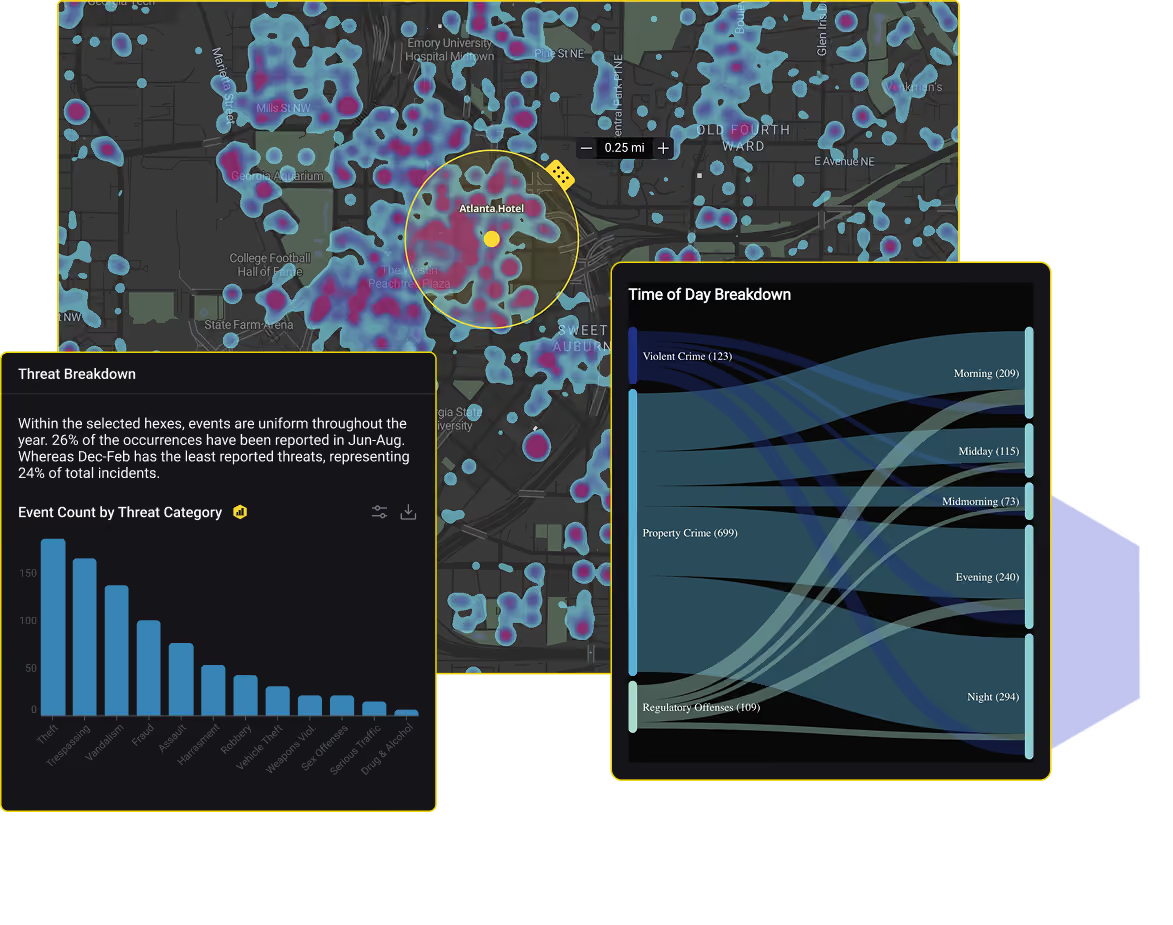
Time of day patterns tell you what guarding a site will actually cost.
Hand real estate and finance evidence that does not need translating.
Take our interactive demo for location assessments.
One score, one method, one map across 5,000+ cities.
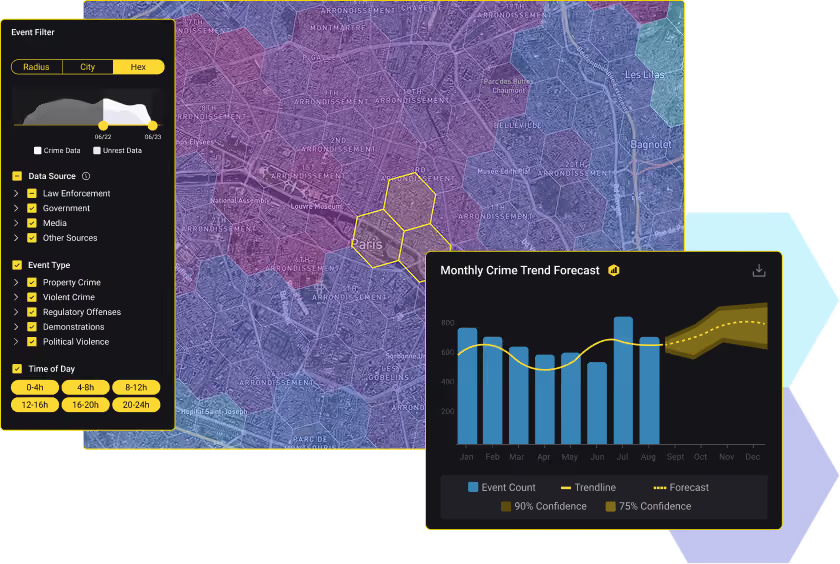
Analyze crime and unrest down to a 0.1 mile radius and H3 hex cells, across 99% of US territory and 5,000+ global cities. A site in a quiet corridor is no longer judged by its city's average, and nobody spends a week gathering the data.
.png)
BaseScore rates every location on one scale, normalized for population and area. Rank your whole footprint in My Locations, watch what moves, and put guards, cameras, and analyst hours where the evidence points. One retailer cut incidents 75% across 16,000 locations.
Export a stakeholder-ready assessment in seconds. Blend your own incident data with external threat data through BaseFusion, and push BaseScore into your GSOC dashboard or BI tool through the REST API.
Four ways teams use location risk before a decision gets made.

Compare prospective locations before lease, opening, or expansion.
.svg)
Give security and operations the same picture of surrounding conditions.
.svg)
Find the sites that deserve detailed review this quarter.
.svg)
Hand real estate and finance a rationale that does not need translating.
BaseScore rates the risk at any location at 0.1 mile granularity on a globally comparable 0 to 100 scale. You can customize what threat categories are included so you only score threats relevant to your business. Then dive deeper at any location with heatmaps, time of day, and seasonality, so your analyst can show exactly what drove the number.
Risk changes inside a single mile. Analyze down to a 0.1 mile radius, so a site in a quiet corridor is not judged by its city's average.
Time of day, day of week, seasonal, and multi-year views separate normal variation from a real shift, and tell your guard force when to be where.
Score every site on the same scale and flag changes, so 50 or 5,000 locations become a prioritized dashboard instead of a spreadsheet.
Export a stakeholder-ready assessment with the evidence attached. No rebuilding the deck for every request.
A REST API delivers BaseScore and location statistics to your GSOC dashboard, BI tool, or travel platform, with minimal IT lift.
BaseFusion blends your internal incident data with external threat data, so your own history shapes the score.
Base Operations is an annual enterprise subscription for physical security, intelligence, GSOC, protective intelligence, and risk teams managing a multi-location footprint.
Built for you if…
WHAT HAPPENS NEXT
Get a straight answer in one call
Map your use case and locations.
We start with your footprint and the calls your team owns.
Score real addresses.
We show BaseScore for locations in your portfolio, not a demo dataset.
Get a straight answer on fit.
Get concrete answers on coverage, scope, and rollout, including where our data is not strong enough for you.
Not the right fit if…
75%
incident reduction at a 16,000-location retailer
4x
route monitoring capacity at a global 3PL
70%
faster intelligence delivery at a top-25 retailer
Base Operations improved our executive security posture by enabling us to proactively identify threats and adjust security measures in both existing, remodeled, or newly acquired residential properties for senior executives. Nearby residential high net worth burglaries and break ins could have been a wake-up call too late. Instead, it became an opportunity to demonstrate the value of data-driven security planning.


Street level intelligence for EP teams is an absolute game-changer. If you're not aware of what this is, the implications, and how this benefits large full scope enterprise teams as well as individual operators, you're behind the curve. I highly recommend folks in the EP space check out Base Operations. Over the last 5+ years, the level of data collected, ingested and analyzed is nothing short of extremely impressive.

Base Operations informs our strategic and routine security planning across the world. The unmatched granularity of micro-intelligence supports our supply chain security planning and dramatically improves our travel security guidance.

Quickly became our key risk evaluation tool for event, travel, and office security. New use cases developed weekly from real estate to leadership insights. Great platform!

In the past 5 days I haven’t closed Base Operations. I give It a 10 out of 10.

What enterprise security teams need to know before deciding whether this is worth an evaluation.
Bring two or three candidate addresses. We will score them live and show you how the comparison holds up.
.avif)
.svg)