
The U.S. Manufacturing Reshoring Security Report 2025
The administration’s tariff overhaul is driving urgent decisions around re-shoring manufacturing. As companies race to establish U.S. production sites, security leaders have a unique opportunity to guide decisions with data-driven site assessments—shaping national infrastructure for years to come. Read the full report of Base Operations analysis of 150+ million mapped incidents at regional, city-wide, and sub-mile granularity for top manufacturing hubs in the US.

Executive Summary
Strategic Challenge: The accelerating reshoring of manufacturing to the U.S., driven by trade tensions and federal policies, creates unprecedented security challenges requiring swift, data-driven decision-making.
Physical Threat Analysis: Base Operations analyzed 150+ million mapped incidents at regional, city-wide, and sub-mile granularity for top manufacturing hubs in the US.
Key Business Implications:
- Critical infrastructure selection decisions are being made without adequate security intelligence
- Manufacturing sites within the same city can face up to a 75-point difference in security risk
- Effective site selection can reduce potential security incidents by up to 55% (based on customer case studies)
- Security readiness must be factored into reshoring timelines to prevent operational disruptions
Strategic Recommendations:
- Incorporate street-level security assessment into site selection process
- Prioritize security investments based on quantifiable risk metrics
- Implement security strategies tailored to different threat landscapes
- Establish ongoing monitoring protocols to track evolving threats
The administration’s tariff overhaul is driving urgent decisions around re-shoring manufacturing. As companies race to establish U.S. production sites, security leaders have a unique opportunity to guide decisions with data-driven site assessments—shaping national infrastructure for years to come.
- Cory Siskind, CEO of Base Operations
Reshoring Security Context
Domestic reshoring has accelerated due to several critical factors: the 2018-19 US-China trade war, COVID-19 pandemic, 2021 Suez Canal obstruction, and Russia's aggression against Ukraine. These events highlighted global supply chain fragility and national security risks including vulnerability to espionage, sabotage, intellectual property theft, and cyber attacks.
Federal initiatives like the CHIPS and Science Act (2022) and Inflation Reduction Act (2022) have incentivized reshoring of semiconductor manufacturing and green technologies.
The second Trump administration has further catalyzed this trend, with new tariffs driving organizations to rapidly relocate operations to the US. The administration's focus on Canada and Mexico has also reduced the viability of friendshoring and nearshoring options.
This rapid repositioning creates significant challenges for security teams. Base Operations’ analysis of 150+ million mapped incidents reveals that manufacturing facilities located just 2 miles apart can experience up to a 75-point difference in risk exposure, underscoring the importance of street-level threat data for capital-intensive site decisions.
Security teams must evaluate not only facility locations but also personnel safety, transportation routes, shock events, civil unrest risks, and resource management—tasks complicated by the limited availability of granular threat intelligence for many cities.
This report analyzes the security risk profile of major manufacturing hubs in the U.S. using Base Operations. It provides a national risk ranking of major manufacturing hubs using BaseScore, our proprietary threat scoring system. It offers city spotlight analysis of Chicago, Seattle, Charlotte, and Houston. It shows why sub-mile risk analysis of Boston and Cambridge reveals critical insights for security. Finally, it presents an actionable security framework for reshoring site selection and ongoing risk monitoring.
We hope you find the threat analysis and security frameworks helpful. If you want a BaseScore report for your own locations, request your free custom BaseScore report.
What is BaseScore?
BaseScore enables precise, dynamic, and comprehensive evaluations of security risks. Using a proprietary threat scoring system that ranges from 0 to 100, BaseScore offers granular insights down to a 0.75-mile radius so organizations can quickly and accurately compare threat levels across locations. Unlike traditional models that rely on outdated, static reports, BaseScore updates monthly by analyzing data from over 10,000 sources.

BaseScore allows comparison of potential manufacturing or distribution sites using objective, data-driven criteria. It highlights overall threat levels and the breakdown of crime categories and subcategories to help companies identify locations with higher operational risks. BaseScore enables companies to proactively evaluate sites based on current conditions and emerging patterns to support long-term resilience and workforce safety. Learn more about BaseScore here.
Security Risk Ranking of National Manufacturing Hubs
The section ranks select U.S.cities by BaseScore with their threat breakdown and risk level.
This table highlights the wide range of security risk profiles across a selection of the top manufacturing hubs in the U.S. Using a data-driven approach to site assessment and planning, security teams can help their organizations achieve the supply chain resilience and operational control that motivated their reshoring decisions in the first place.
The following sections highlight regional risk overviews, city spotlights, and sub-mile risk analysis for select cities. Want a BaseScore ranking for your own sites? Request a free custom BaseScore report from our team.
Regional Risk & Security Impact
This section provides a regional overview of risk, analysis, and security implications.
Northeast
Average BaseScore: 53.2
- Risk Profile: Highest average BaseScore and violent crime rate (25.8%)
- Security Implications: Higher security costs must be factored into budgeting
- Analysis: Dense urban centers like Philadelphia, New York City, and Buffalo drive elevated risk levels. As these urban environments are older, legacy crime problems can persist and become entrenched. While infrastructure and talent are strong assets in this region, the elevated risk levels suggest higher security costs and more robust mitigation planning from day one.
- Tactical Approach: Invest in comprehensive physical security measures with emphasis on personnel protection and physical deterrents
Midwest
Average BaseScore: 44.4
- Risk Profile: Significant violent crime in key manufacturing hubs (Detroit: 34%, Cleveland: 28%)
- Security Implications: Personnel safety is priority concern
- Analysis: The region faces significant violent crime exposure, particularly in cities like Detroit and Cleveland, requiring tailored security solutions focused on personnel protection.
- Tactical Approach: Focus on employee safety protocols, secure transportation options, and enhanced facility access controls
West Coast
Average BaseScore: 44.0
- Risk Profile: Property crime dominates (65.8% average) with high theft rates
- Security Implications: Asset protection is primary concern
- Analysis: The West Coast is heavily skewed toward property crime (partly stemming from inequity factors surrounding homelessness), with rates averaging 65.8% in places like San Francisco and Seattle.
- Tactical Approach: Prioritize perimeter security, surveillance systems, and cargo protection measures
Central U.S.
Average BaseScore: 38.8
- Risk Profile: Highest property crime rate (73.6%) but low violent crime (16.8%)
- Security Implications: Manageable threat environment with targeted concerns
- Analysis: Despite a lower average BaseScore, the region has the highest property crime rate (73.6%), suggesting high exposure to theft and vandalism in certain urban corridors like Minneapolis and St. Louis. The low violent crime rate indicates a manageable threat environment for many operations.
- Tactical Approach: Focus resources on specific asset protection based on local crime patterns
South & Southeast
Average BaseScore: 36.75
- Risk Profile: Generally lower security risk across major metrics
- Security Implications: Most favorable conditions for reshoring with lower security overhead
- Analysis: Cities like Charlotte, Greenville, and San Antonio offer particularly favorable conditions for reshoring, with lower threat volatility and fewer high-risk zones. However, cities in these regions still warrant monitoring for regional growth pressure and inequality-related crime shifts.
- Tactical Approach: Standard security measures with regular monitoring for emerging threats
City Risk Spotlight
This section provides an analysis of four U.S. cities with significant manufacturing footprints and notable BaseScore variance across industrial zones/infrastructure.
Chicago, Illinois
Chicago is a major U.S. economic powerhouse known for its diverse industrial base, strategic central location, and global connectivity. The city has traditionally been a hub for finance, transportation, and manufacturing, while recently expanding into technology, healthcare, and professional services.
Chicago’s economic strength is reinforced by its skilled workforce, robust infrastructure, vibrant startup ecosystem, and proximity to world-class universities such as the University of Chicago and Northwestern University.

Key Economic Sectors
- Manufacturing:
- Food processing and packaging (leveraging proximity to agricultural supply chains)
- Industrial machinery
- Transportation equipment (railcars, trucks, construction machinery)
- Emerging Industries:
- Technology (innovation hubs like Fulton Market, attracting Google, Salesforce, Meta)
- Healthcare
- Professional services
Infrastructure Highlights
- Air Travel: Chicago O’Hare International Airport, a global hub for domestic and international flights
- Rail Freight: Major hub with convergence of six out of seven Class I railroads, supporting nationwide distribution
- Maritime Shipping: Port of Chicago (Lake Michigan), connected to the Mississippi River, facilitating domestic and international trade via the Great Lakes-St. Lawrence Seaway
IIllinois International Port District Risk Metrics
Reporting Scope: Immediate (0.5 mile) and Expanded (1.5 mile) Radius

Chicago O'Hare International Airport is located in the northwest of the city in a more suburban area. At a radius of 2.5 miles, the BaseScore averages at 16 (low-risk). 23% of the events reported within the selected radius are Violent Crimes and 65% are Property Crimes.
Theft and Simple Assault are the highest reported categories within the selected radius (35% and 15% of all crimes), followed by Vehicle Theft, Vandalism, Trespassing, and Weapons Violations. The low-risk area around the airport makes it ideal for moving executives, as well as airside cargo operations.

Unrest within the city (depicted in the image below) is largely confined to the Loop, Lakeshore East, and Magnificent Mile neighborhoods. The Loop is the civic heart of the city, home to the Cook County Building and Richard J. Daley building, as well as a number of attractions and cultural landmarks. These include Grant Park, Millennium Park, the Symphony Center, and the Civic Opera House.
Although the concentration of unrest in these areas helps insulate key transportation and industrial zones, security teams are advised that many of the city’s hotels cluster in this area as well. Executive protection personnel are advised to check for unrest trends before moving VIPs through this area.

Seattle, Washington
Seattle is a dynamic city with a diverse economy, prominently excelling in technology, aerospace, maritime, and life sciences. The city has become globally recognized as a technology hub, thanks to tech giants such as Amazon and Microsoft, which attract startups and established firms alike.
Key Economic Sectors
- Technology:
- Birthplace of Amazon and Microsoft
- Thriving innovation ecosystem attracting startups and tech firms
- Aerospace:
- Major operations by Boeing
- Key contributor to manufacturing and engineering sectors
- Maritime:
- Robust maritime industry anchored by the Port of Seattle
- Critical to international trade and thriving cruise industry
- Life Sciences and Healthcare:
- Renowned institutions including the University of Washington and Fred Hutchinson Cancer Research Center
- Strong contributions to medical research and biotechnology advancements

Infrastructure Highlights
- Air Travel: Seattle-Tacoma International Airport (Sea-Tac), connecting domestically and internationally (particularly Alaska and Asia)
- Public Transit:
- Extensive bus network operated by King County Metro
- Light rail services by Sound Transit
- Commuter trains like the Sounder, linking Seattle to surrounding areas
Seattle’s economic success is strongly supported by its effective transportation infrastructure, innovation-driven industries, and premier research institutions.
Seattle, Washington Crime Risk Metrics
Reporting Period: January 1, 2024 – February 28, 2025

The Port of Seattle falls within this high risk area. For the 1 mile radius around the Port, there is an average BaseScore of 83. Trespassing was the most frequently reported crime (4,191 assessed incidents), which consisted of 16% of all offenses within the radius.
There were also 64 reports of Organized Crime, indicating that security personnel in the area may need to take precautions against gang activity or criminal enterprises. Such measures may include partnering with local and federal law enforcement to share intelligence and establish points of contact, conducting OSINT, distributing intelligence briefs on identifying insignia/gang markers, and posting photos of prominent members.
Within the one mile radius around the Port are also major points of interest, including the Space Needle, Climate Pledge Arena, and Memorial Stadium. Security teams are advised that these POIs can generate spikes in pedestrian traffic and tourism activity, both of which can be magnets for petty crime. Executive protection personnel are cautioned that traffic in this area can be impacted by frequent special events.
Charlotte, North Carolina

Charlotte is a diverse and dynamic economic center known for its strengths in several critical sectors. Its strategic infrastructure and diversified industries contribute significantly to its economic vibrancy and attractiveness as a business destination.
Key Economic Sectors
- Financial Services:
- Recognized as the second-largest banking hub in the United States
- Hosts prominent financial institutions like Bank of America and Truist Financial
- Advanced Manufacturing:
- Industries include automotive, energy, and food processing
- Notable presence in manufacturing excellence
- Energy and Steel Production:
- Home to leading companies such as Duke Energy and Nucor
- Prominent in energy provision and steel manufacturing
- Technology:
- Rapidly expanding sector attracting startups and established tech firms
Infrastructure Highlights
- Air Travel: Charlotte Douglas International Airport (CLT), a major transportation hub offering extensive domestic and international flights
- Rail Systems:
- Investment in expanding rail infrastructure
- Planned Silver Line light rail connecting critical areas, including the airport, enhancing commuter and cargo transport
Charlotte Crime Risk Metrics
Reporting Period: January 1, 2024 – February 28, 2025

Charlotte Douglas International Airport Risk Metrics
Norfolk Southern Yard and Amtrak Station Risk Metrics (Charlotte)
- BaseScore near city center (First and Fourth Wards): 81 (high risk)
- Average BaseScore within 1-mile radius: 51; increases to 54 within 1.5 miles
- Hotspots for Drug & Alcohol Violations
- Advisory:
- Many hotels situated within high-risk zones
- Recommended sign-up for CharMeck emergency alerts
- Monitor events at Bank of America Stadium and Spectrum Center for increased traffic and security considerations

Houston, Texas

Houston is globally recognized as the "Energy Capital of the World," playing a vital role in oil and gas, chemical manufacturing, and aerospace industries.
Key Economic Sectors
- Energy:
- Over 4,700 energy-related firms
- Home to 38 of the nation's 85 publicly traded oil and gas companies
- Chemical Manufacturing:
- Houston Ship Channel, a leading petrochemical complex globally
- Major operations by LyondellBasell and Westlake Chemical
- Aerospace:
- NASA's Johnson Space Center
- Central hub for human spaceflight training, research, and mission control
- Robust presence of aerospace contractors and space exploration firms
Infrastructure Highlights
- Maritime Shipping: Port of Houston, one of the world’s busiest ports by foreign tonnage, crucial for energy and chemical product trade
- Air Travel: Extensive services through George Bush Intercontinental Airport (IAH) and William P. Hobby Airport (HOU), facilitating domestic and international connections
Houston's economic strength is underpinned by its extensive transportation infrastructure, industrial diversity, and global industry leadership, making it a central node in global commerce and innovation.

Houston Crime Risk Metrics
Reporting Period: January 1, 2024 – March 31, 2025

Port of Houston Risk Metrics
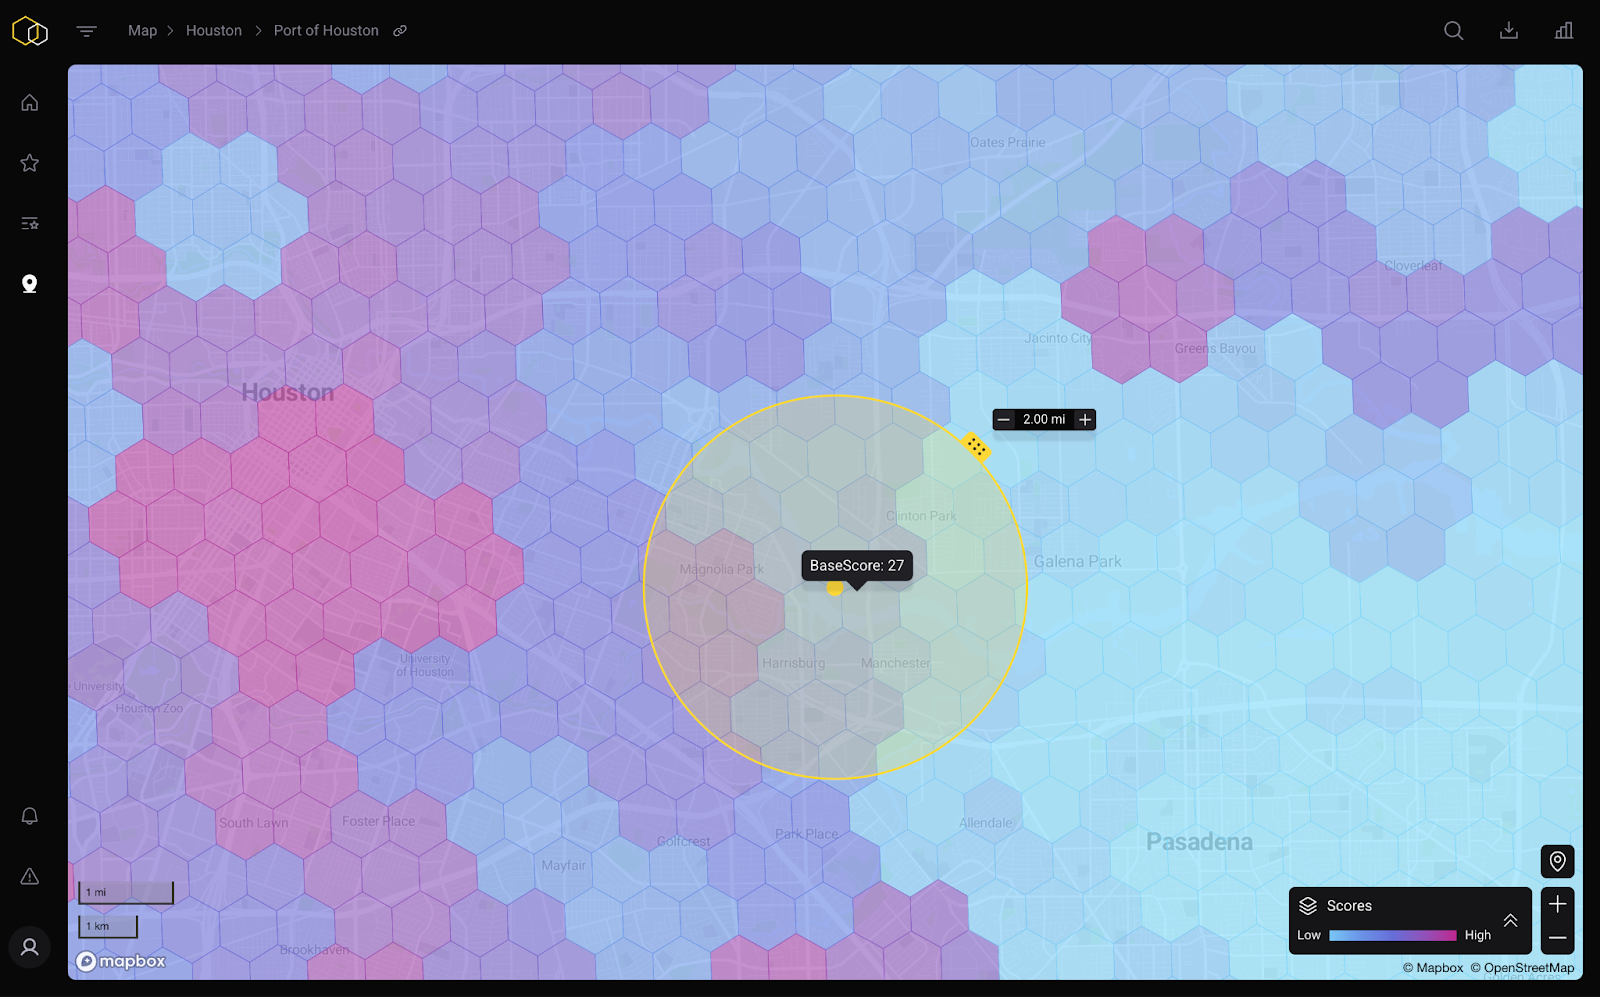
Location: Southeast Houston within a varied threat landscape
Reporting Scope: 2-Mile Radius
Sub-Mile Threat Assessment
This section provides an in-depth analysis of Boston and Cambridge (Massachusetts) to show how granular, sub-mile threat assessments offer valuable insights.
Boston and Cambridge, Massachusetts

Boston and Cambridge together represent a global epicenter of innovation, education, and economic strength, characterized by a diverse economy driven by life sciences, healthcare, higher education, financial services, and technology.
Key Economic Sectors
- Life Sciences and Biotechnology:
- Prominent institutions: Harvard University, MIT, Massachusetts General Hospital, Boston Children's Hospital
- Headquarters of major firms including Moderna, Biogen, Takeda
- Cutting-edge research, drug development, and manufacturing
- Innovation and Startups:
- Kendall Square, Cambridge, renowned as the world's densest innovation district
- Extensive ecosystem of biotech, pharmaceutical companies, and startups supported by proximity to academic research, talent, and venture capital
- Technology:
- Growing sectors include AI, cybersecurity, and healthtech
- Financial Services:
- Major companies such as Fidelity Investments and State Street Corporation underpin economic stability
Infrastructure Highlights
- Air Travel: Logan International Airport, facilitating extensive global passenger and cargo connections
- Maritime Trade: Port of Boston, critical for international logistics and trade
- Strategic Infrastructure Development:
- MBTA's planned purchase of Widett Circle for a commuter rail layover yard, enhancing train storage and service near South Station
The Boston-Cambridge region thrives due to its strong academic foundations, vibrant innovation ecosystem, strategic infrastructure, and dynamic economic diversity.
Boston Crime Risk Metrics
Reporting Period: January 1, 2024 – March 30, 2025
Cambridge Crime Risk Metrics
Reporting Period: January 1, 2024 – March 30, 2025

Security personnel are advised that both Cambridge and Boston experience elevated levels of unrest, often linked to civic activism and political demonstrations.
In Cambridge, high protest activity is largely driven by student activism on the campuses of Harvard and MIT, with 90 peaceful protests, two incidents of looting/destruction, and two instances requiring police intervention reported between 1/1/24 and 3/30/25. Common themes include Israel’s military action in Gaza, ICE detentions, and opposition to the Trump administration.
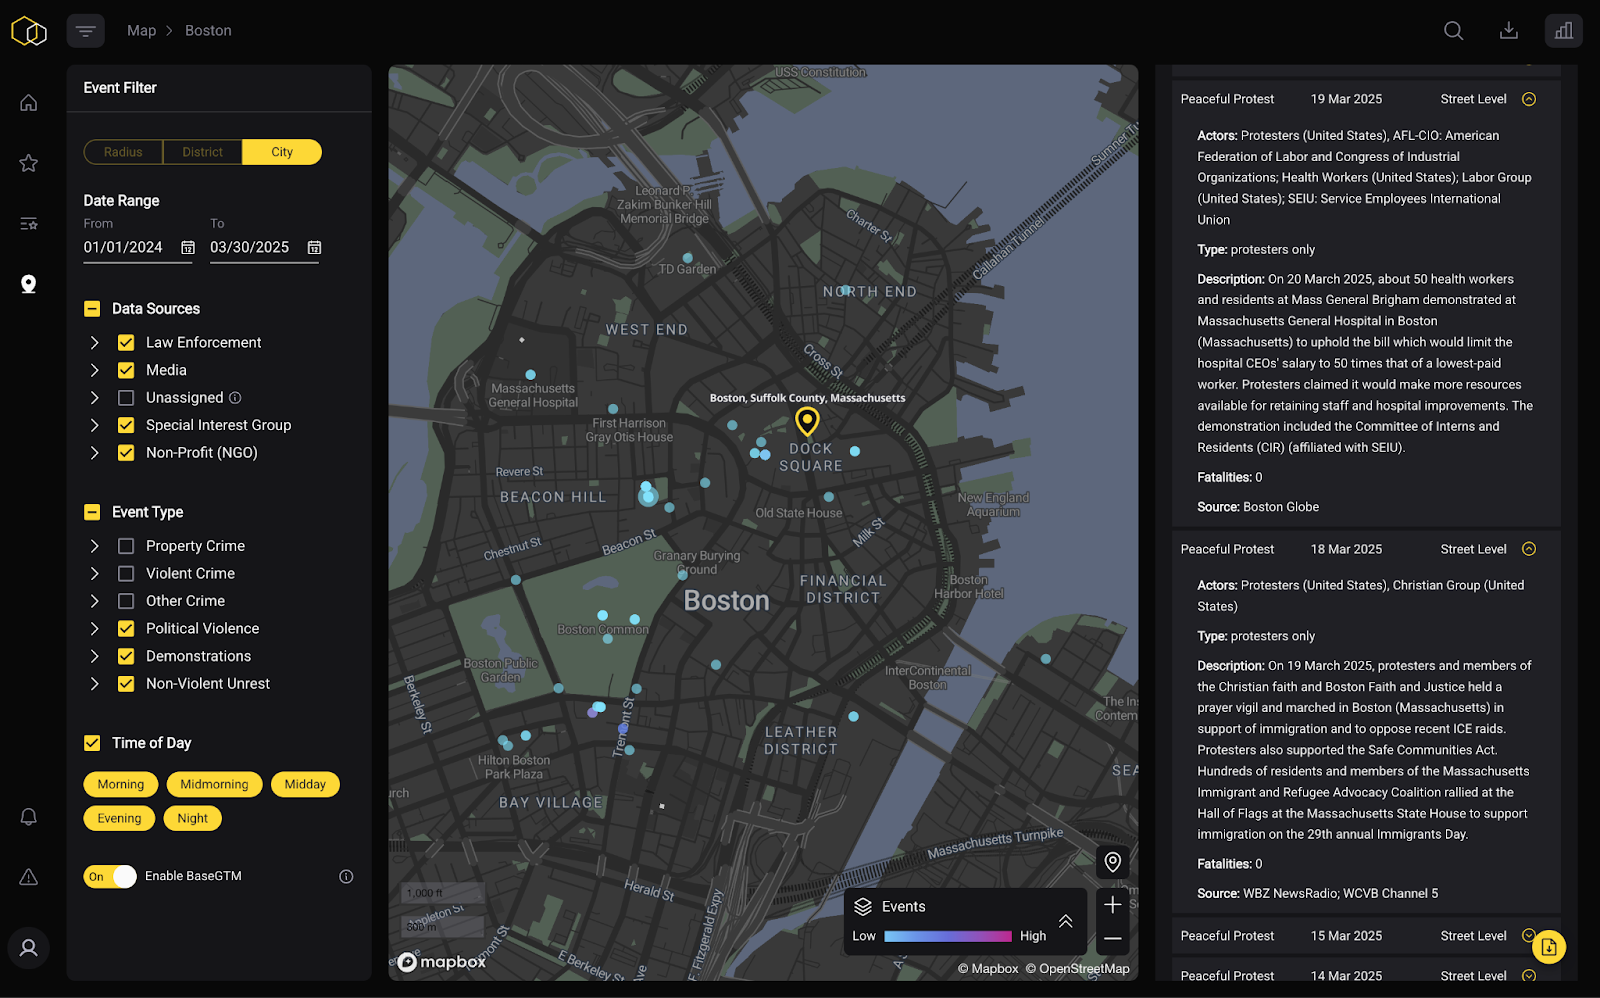
In Boston, protest activity is concentrated around Beacon Hill, Dock Square, and Boston Commons—areas that house key civic institutions such as the Massachusetts State House. Demonstrations here have focused on labor rights, diversity and inclusion, and similar causes to those seen in Cambridge.
Organizations considering operations in either city are advised to assess whether their mission, leadership, or affiliations intersect with repeated protest themes, and to proactively monitor areas near key government or academic institutions.
The concentration of unrest in this area of the city means that many industrial areas and critical infrastructure sites are insulated from this activity. However, security teams are advised that the city’s major commuter hubs largely fall within this zone (Back Bay, South Station, State, and North Station).

Base Operations empowers analysts to monitor unrest trends, as well as identify recurring dates of significance to activist groups, so alerts and travel advisories can be sent to employees. For personnel that are relocating due to reshoring operations, security teams can also use it to recommend safe residential areas. Teams can create saved locations within the Base Operations to monitor changes in risk in the areas surrounding any commuter location of interest.

Conley Terminal Risk Metrics (Boston Port)
Security teams are advised that while Conley Terminal itself is within a relatively low-risk area, that vehicles travelling to and from the facility may have to pass through high-risk areas of South Boston and the Seaport neighborhood to the north. Base Operations’ users are not just empowered to assess sites, but also plan secure routes for personnel.

Widett Circle Crime Risk Metrics
Reporting Scope:Half-Mile Radius
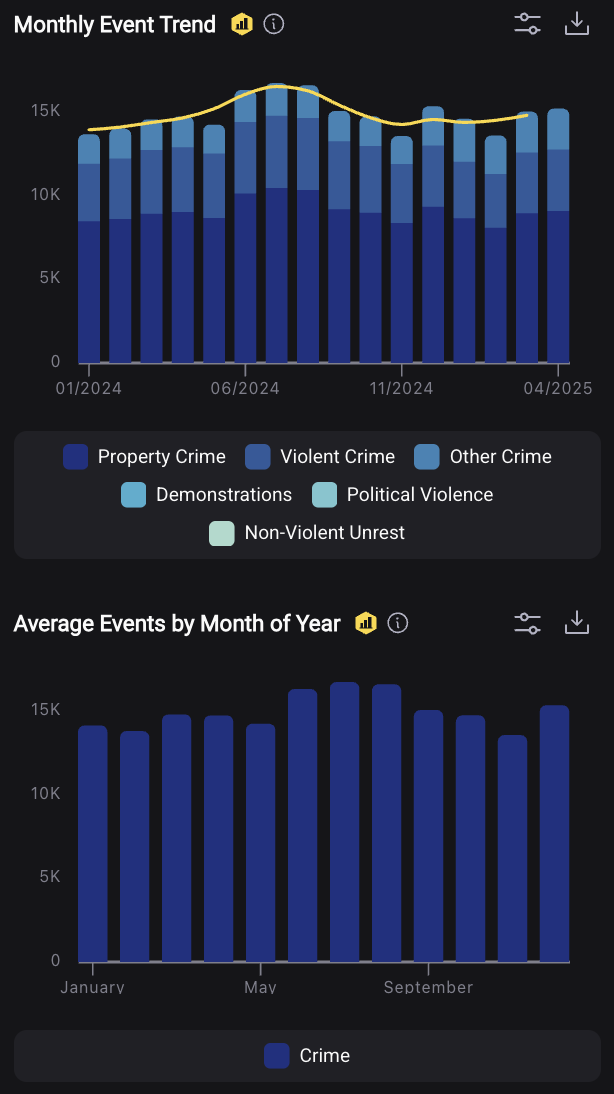
For both citywide and radius analyses, Base Operations provides trend forecasting capabilities. These forecasts can be applied to overall crime trends, as well as specific crimes. In both instances, they are powered by Base Operations’ proprietary Global Threats Model (GTM). Trained off of millions of data points, GTM is effective in any location and can mitigate data quality issues that are often present in published Open Datasets. It’s continuously retrained and fed more recent data, meaning that the already robust model is constantly improving.
Forecasting is invaluable for proactive security measures, as well as ascertaining whether volatility and crime waves are likely to persist. The screenshot below illustrates an overall crime forecast for the 0.75 mile radius around Widett Circle.

The precise forecast confidently estimates that there will be a slight trend upwards, but one that is still within historical ranges. On-the-ground security personnel with assets near the Circle can be tasked with monitoring the area by adding a saved location in the Base Operations, as well as liaising with local law enforcement to inquire about the March 2025 spike in crimes.
This analysis of Boston and Cambridge underscores the necessity of hyper-local, data-informed risk assessment in dynamic urban environments. While city-wide statistics offer a high-level view, Base Operations’ sub-mile granularity reveals crucial micro-patterns—such as pockets of unrest near transit hubs, or shifting crime types near critical infrastructure—that often go undetected in traditional security assessments. By leveraging BaseScore data, security teams can move beyond reactive posturing to implement proactive, precision-based strategies.
Actionable Security Framework
This section outlines how to use BaseScore data to make data-driven security decisions, with a focus on reshoring site selection and ongoing operations.
BaseScore Resource Allocation Matrix
Use this structured approach to evaluate potential manufacturing locations based on granular threat levels. This framework is especially valuable during reshoring initiatives, where security investment must be weighed against long-term resilience.
During reshoring, when sites face uncertain environments, a regular risk review cadence ensures security postures adapt to evolving threats. Allocate most security resources to high-risk facilities identified during the reshoring site selection/startup phases.
Customize actions based on threat-specific BaseScore components (e.g. theft vs. violent crime). Implement targeted interventions like:
- Access restrictions.
- Improved lighting.
- Guard patrols.
- Cameras.
Categorizing sites situates teams well to prioritize security efforts in phases. Security teams can also monitor changes in BaseScore to reassess resource allocation.
Phase 1: High- and Critical-Risk Sites (BaseScore 50+)
- Front-load security investment for highest-risk locations
- Implement comprehensive physical security measures before operations begin
- Establish relationships with law enforcement and security partners
- Deploy advanced surveillance and access control systems
- Create detailed security protocols based on specific threat profiles
Phase 2: Medium-Risk Sites (BaseScore 30-49)
- Apply lessons learned from high-risk implementations
- Scale security measures based on specific threat patterns
- Focus on targeted interventions for primary risk factors
- Implement standard security protocols with enhancements for specific threats
Phase 3: Low-Risk Sites (BaseScore 0-29)
- Deploy standard security measures
- Establish monitoring protocols for emerging threats
- Create baseline security awareness among personnel
- Develop scalable security response plans
Site Selection ROI Calculator
Security teams can also evaluate ROI on security investments through:
- Reduced expected losses.
- Fewer security incidents.
- Lower insurance premiums.
- Time savings from analytical efficiency redirected to other security tasks.
Example: For a 100,000 sq ft manufacturing facility
This is an illustrative example. Every company will have unique inputs to calculating these costs and the ROI of proactive site assessments.
Want your own custom ROI calculation? Contact our team.
Trend Analysis Framework
Security teams can use Base Operations to analyze threats that impact reshoring operations.
- Temporal Analysis: Track crime patterns by time of day, day of week, and seasonality to inform operational planning and shift scheduling.
- Geographic Trends: Monitor crime pattern shifts within the area surrounding facilities to identify emerging hotspots.
- Unrest Monitoring: Identify trends in protest activity to mitigate disruptions.
- Forecasting: Use predictive analytics to anticipate potential security challenges.
Take proactive actions (e.g., escalate patrols, engage law enforcement) before threats escalate. Conduct thorough site assessments before committing security resources.
This autonomous vehicle company used Base Operations to assess risk in new markets, guiding confident expansion decisions.
Custom BaseScore Report
Decode your risk landscape to prioritize site security. Get threat intelligence for up to 5 locations in your free custom BaseScore Report.
What You'll Get:
- Comprehensive Risk Profiles for 5 locations with our proprietary 0-100 BaseScore™ model
- Comparative Risk Ranking showing how locations measure against each other
- Detailed Threat Breakdowns of specific risks (theft, assault, vandalism, etc.) at each site
- Time-of-Day and Day-of-Week Analysis revealing when risk patterns spike
- Threat Heatmaps showing risk variations at a sub-mile radius
How It Works:
- Submit Your Locations - Provide the 5 addresses or coordinates you need assessed.
- Receive Your Report - Base Operations generates your comprehensive BaseScore™ report.
- Optional Consultation - Schedule a 30-minute call with our security experts to discuss findings.
Get your free custom BaseScore Report here for up to 5 locations.
Conclusion
The dramatic variations in risk profiles within small geographic areas - with BaseScore differences of up to 75 points between locations 2 miles apart - highlight the critical importance of granular, street-level security intelligence in the site selection process.
Security teams supporting reshoring initiatives should:
- Start early: Integrate security assessment into the site selection process before commitments are made
- Think granular: Look beyond city-level data to understand specific neighborhood and street-level risks
- Plan comprehensively: Address facility security, personnel safety, and transportation security
- Allocate strategically: Prioritize security investments based on quantifiable risk metrics
- Monitor continuously: Establish ongoing risk assessment protocols that adapt to changing conditions
By implementing a structured, data-driven approach to security assessment and planning, organizations can transform security from a reactive cost center to a strategic enabler of successful reshoring initiatives, helping achieve the supply chain resilience and operational control that motivated their reshoring decisions in the first place.
Takeaways

Join 1100+ security leaders getting new ideas on how to better protect their people and assets.