Executive Protection Route Planning: Using Threat Data to Build Safer Routes
Learn how executive protection teams use street-level threat data to plan safer routes. Covers data types, step-by-step process, tools, templates, and how Base Operations enables data-driven EP.

What Is Threat-Data-Driven Route Planning in Executive Protection?
Threat-data-driven route planning is the practice of layering street-level crime data, civil unrest intelligence, geopolitical context, and traffic conditions onto physical route decisions to reduce a principal's exposure to predictable risk during transit. Eighty-five percent of security leaders report an increasing volume of physical threats against executives, according to an Ontic survey widely cited across the corporate security industry, and that trend has pushed route planning from a habit-based task into a documented, defensible part of every protective operation.
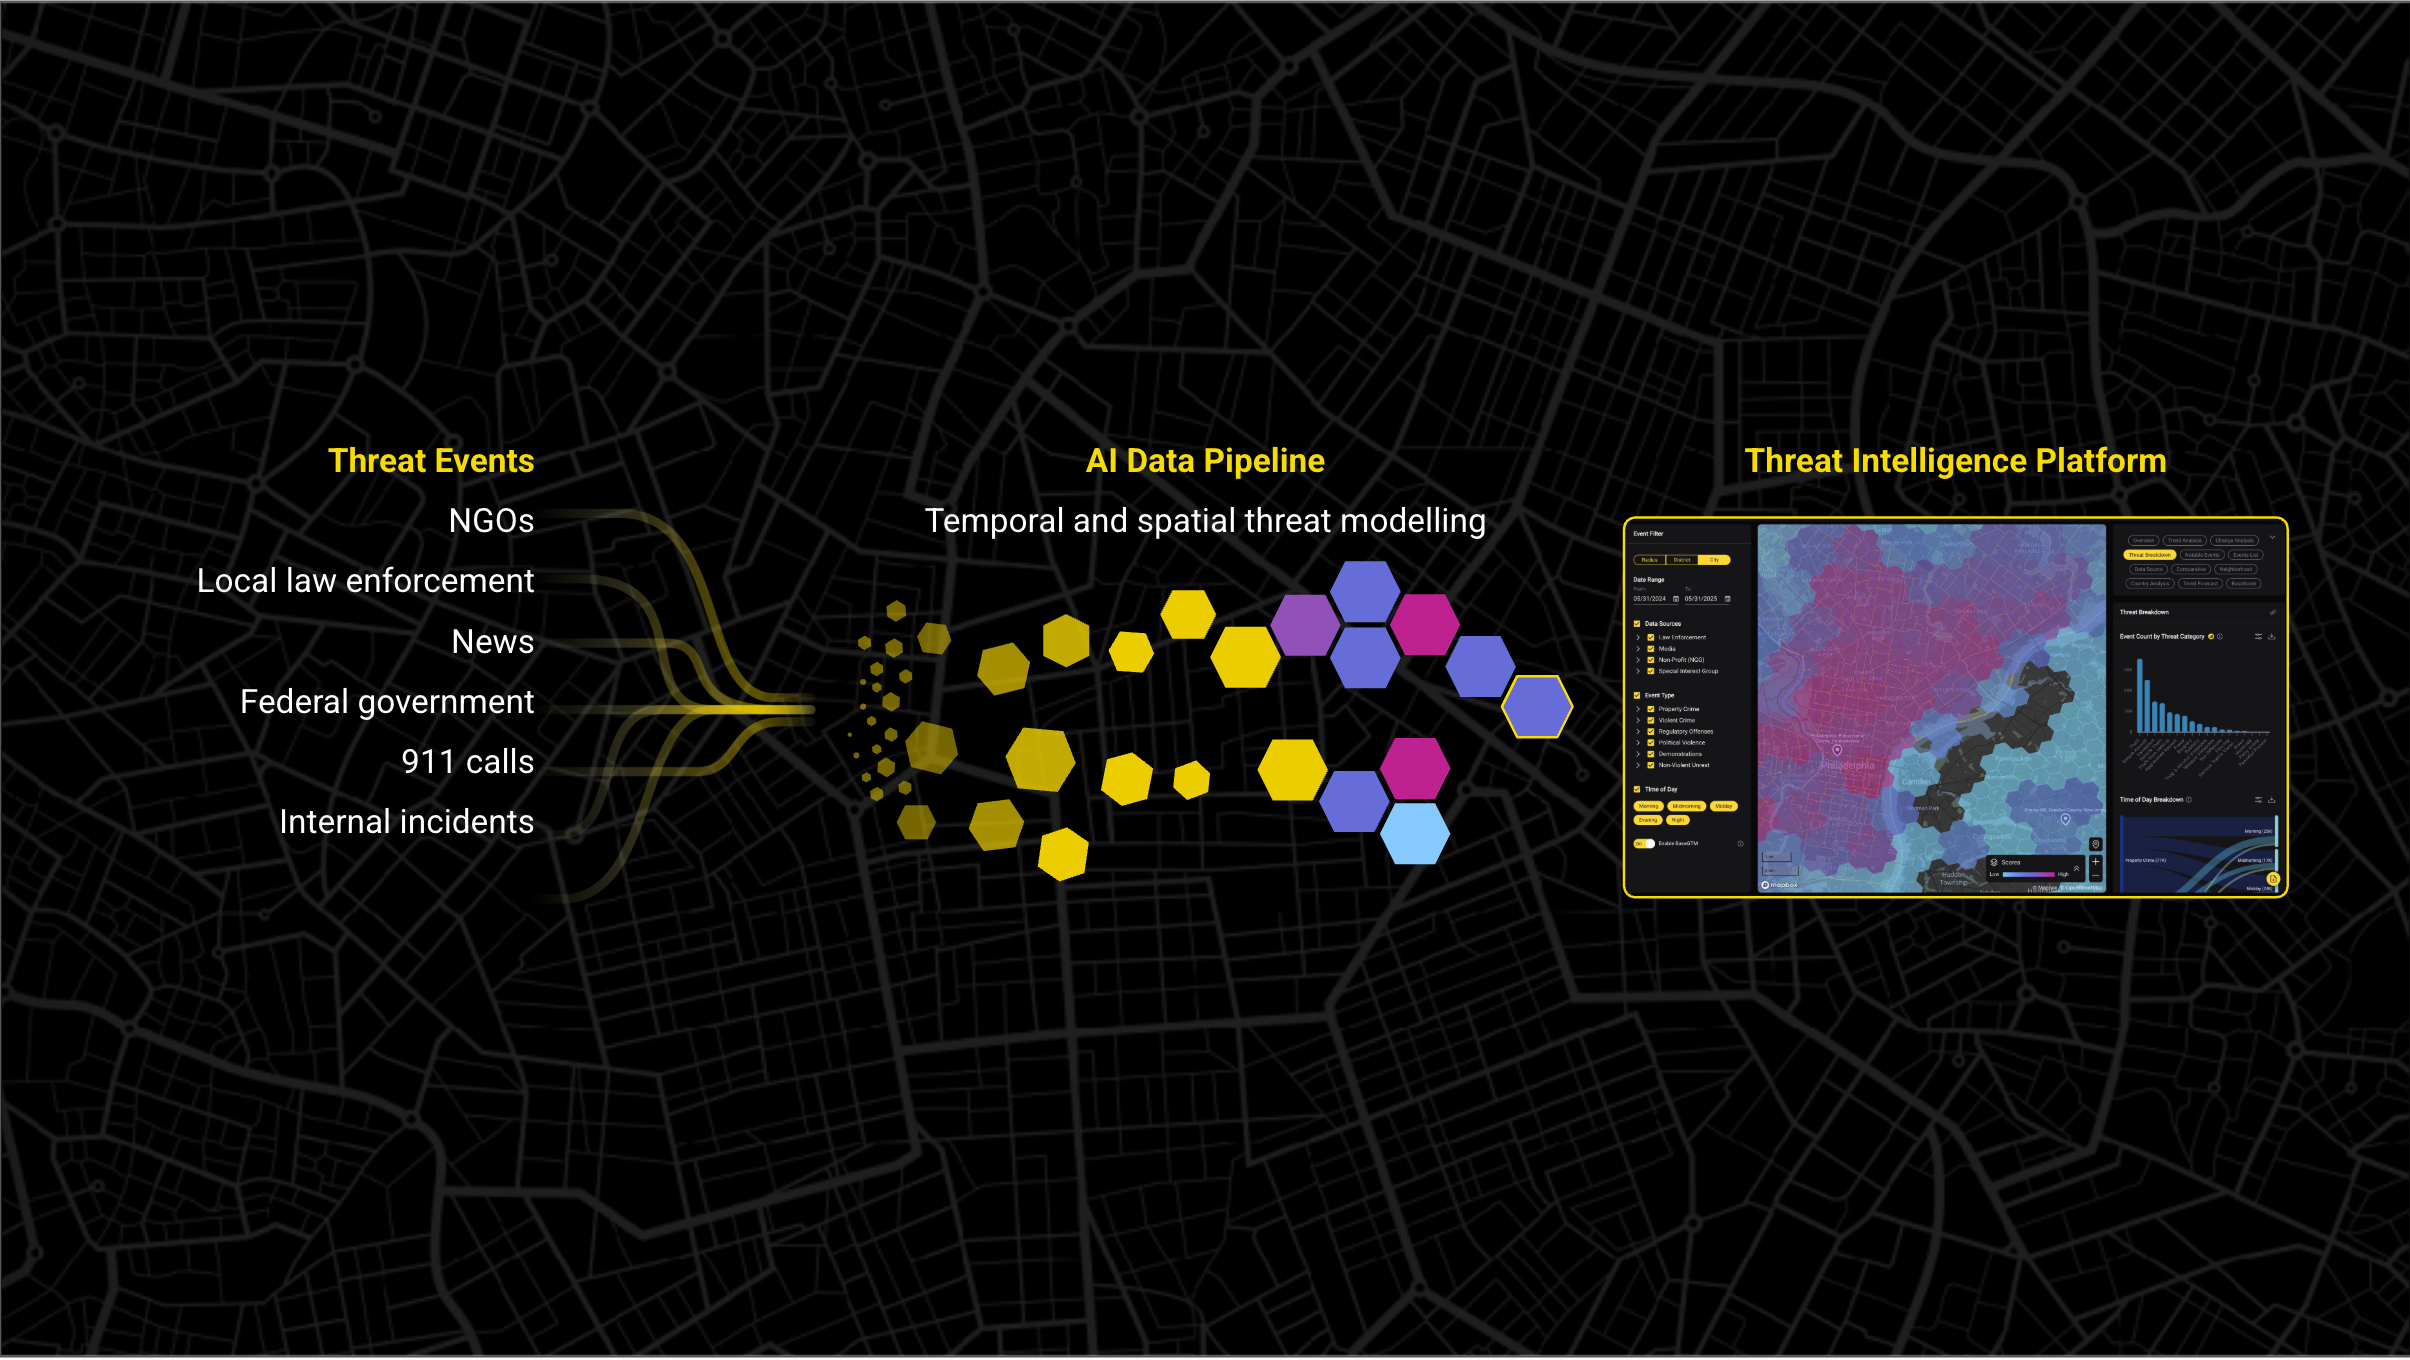
Conventional GPS routing optimizes for time and distance. It has no concept of a choke point, a crime hotspot, or a demonstration forming three blocks from a planned turn. Executive protection (EP) route planning optimizes for a different variable: exposure. Platforms built for this purpose, including Base Operations, score routes using a standardized metric like BaseScore™ rather than raw incident counts, so teams can compare corridors on the same scale.
Threat-data-driven route planning treats every route as a risk decision built on evidence, not habit.
Why Route Planning Is the Highest-Vulnerability Phase of Executive Protection
Security practitioners across the executive protection field agree on one point: a principal is most vulnerable while in transit. Firms including Westminster Security, the International Security Driver Association (ISDA), and GRS have each made this observation independently. A principal walking a fixed path between a residence and an office presents a target that requires no surveillance to locate, because the location and timing are already known.
That vulnerability is compounding. The 85% increase in physical threats to executives noted above lands hardest during the transit phase, and 2024 threat data identified homes and transit corridors as the locations carrying the highest threat rate of any point in a principal's daily movement.
Traditional route planning fails to account for this because it relies on memory, habit, and generic travel advisories rather than current, location-specific evidence. A driver who has run the same route for two years develops confidence in that route's safety that the underlying data may no longer support.
This is where protective intelligence enters the picture. Protective intelligence is the discipline of identifying, assessing, and managing threats to a specific individual by gathering and analyzing information relevant to that person's movements, associations, and environment. Applied to route planning, it turns a route from a fixed habit into a living assessment, updated as conditions change. This shift, from manual, memory-based selection to a documented process, is one of several ways to modernize executive protection, and it is the difference between a program that can defend its decisions after an incident and one that cannot.
The Five Core Threat Data Categories EP Teams Must Layer Into Routes
Effective route planning requires layering five distinct categories of threat data onto every proposed path. EP teams that rely on only one or two leave dangerous gaps in the assessment.
Street-Level Crime Data (Violence, Robbery, Vehicle Theft)
Street-level threat intelligence is threat data analyzed at 0.1 to 0.2 mile resolution, enabling block-by-block risk differentiation rather than neighborhood or city averages. This is the foundation layer for route planning because crime risk rarely follows administrative boundaries. Two intersections three blocks apart can carry meaningfully different violent crime rates.
EP teams have consistently told Base Operations that route planning requires sub-mile precision. A route that runs three blocks off a planned corridor can pass through a materially different threat environment, and a district-level average will not reveal that. One caution: a high aggregate score does not always mean violent crime. It can reflect a high volume of lower-severity incidents like vehicle break-ins, so teams need the category breakdown behind the score, not just the number, to make a sound routing decision.
Civil Unrest and Protest Activity Intelligence
Civil unrest intelligence tracks demonstrations, protests, and permit filings that can transform a normally quiet route into a blocked or volatile one within hours. A planned march that closes three downtown blocks turns a primary route into a liability if it is not caught during pre-trip planning.
Security teams flag a recurring problem here: alert volume without context. A stream of unrest notifications is only useful if the team can tell how unusual the activity is relative to that location's baseline. Route planning benefits from combining current unrest signals and social media indicators with historical pattern data, so a single flagged event does not trigger an unnecessary route change and a genuine disruption does not get missed.
Geopolitical and Travel Risk Context
Geopolitical and travel risk context supplies the macro layer that frames local route decisions. Sources like OSAC (the Overseas Security Advisory Council), Seerist, and Crisis24 track country and regional-level instability, government advisories, and travel restrictions.
The shift EP teams need to make is moving from country-level judgments to street-level route decisions within that country. A national travel advisory tells a team whether to send a principal to a country at all, not which corridor between the airport and hotel carries the lowest transit risk. Both layers matter, but only the granular layer informs the actual route.
Real-Time Traffic, Road, and Infrastructure Data
Traffic, road, and infrastructure data covers construction closures, accident reports, and road quality, all of which affect both timing and security posture. A closure that forces a detour can push a route directly through a previously avoided choke point.
Road quality also matters for armored vehicles, which have different clearance, turning radius, and weight tolerances than standard passenger vehicles. EP teams should cross-reference traffic data against choke points already identified in the threat assessment, because a closure rarely creates a new risk in isolation; it usually routes traffic into one that was already flagged.
Digital and Social Media Threat Signals
Digital and social media threat signals monitor open-source posts, doxxing activity, and targeted threats that can translate directly into physical route risk. A threat posted publicly against a principal, or a location tagged in a post near a planned stop, belongs in the same assessment as street crime data.
Vendors like Dataminr and LifeRaft specialize in this detection layer. Few platforms in this category connect digital signals directly to specific route corridors: tying a dark web mention or a flagged social post to the exact block a principal is scheduled to pass through remains a largely manual exercise across the industry, and it is a clear opportunity for EP teams to build a tighter internal process around.
The EP Route Planning Process: A Step-by-Step Operational Framework
Turning threat data into a usable route requires a repeatable process, not an ad hoc review. The seven steps below give EP teams a consistent framework for any destination.
Step 1: Baseline Threat Assessment Before Route Selection
Advance work is the systematic process of pre-surveying locations and routes before a principal arrives, distinct from advance planning, which covers strategic scheduling and logistics. Baseline threat assessment is where advance work begins.
Before any route gets drawn, the team pulls a baseline risk score for the destination city, the surrounding district, and each specific location the principal will visit. Teams should interpret this baseline carefully: a high score driven by property crime volume calls for a different route response than one driven by violent crime concentration, so pulling the category breakdown behind the score matters as much as the score itself.
Step 2: Primary and Alternate Route Development
The Zone of Total Predictability, a concept developed within the International Security Driver Association and associated with security trainer Steve Powers, describes any route segment where the principal must travel that specific path with no available variance. A single-lane bridge, a gated community's one entrance, or a hotel's sole loading dock all create zones of total predictability, points where an adversary's planning burden drops close to zero.
Route development should produce a minimum of three options: primary, secondary, and emergency. Each gets scored independently against the same threat data layers, and the team selects the primary route based on lowest aggregate exposure, not shortest travel time.
Step 3: Choke Point and Danger Zone Analysis
A choke point is a physical narrowing, such as a bridge, tunnel, or single-lane street, that forces a vehicle into a predictable path regardless of the surrounding threat level. A danger zone is different: an area with elevated threat concentration where risk is statistically higher, independent of any physical constriction.
The distinction matters for route response. A choke point may be unavoidable and requires a mitigation plan, like adjusted speed or spacing. A danger zone can often simply be routed around. Street-level heat maps let teams identify concentrated criminal activity down to specific streets and intersections, the resolution needed to separate a genuine danger zone from routine city-wide background risk.
Step 4: Safe Haven and Emergency Rendezvous Mapping
Every route needs documented safe havens and emergency rendezvous points (ERVs) along its length, not just at the origin and destination. Level 1 trauma hospitals, police stations, and vetted secure facilities all qualify, provided the team has validated each one is operational 24 hours a day.
This step produces contingency options for different threat scenarios, from a medical emergency to a security incident requiring immediate extraction. A safe haven identified during planning but never verified as staffed around the clock is not a safe haven. It is an assumption, and assumptions are what a data-driven process is meant to replace.
Step 5: Time-of-Day and Day-of-Week Risk Profiling
Crime does not distribute evenly across a day or a week. Violent crime tends to peak in evening hours, while property crime, including vehicle break-ins along a parked motorcade route, often peaks in both morning and evening windows. One case study on a Fortune 500 travel company's EP program found property theft concentrated during specific evening hours in hotel districts, information that directly shaped scheduling decisions.
Time-of-day and day-of-week breakdowns let EP teams adjust departure windows rather than accept a fixed schedule. Moving a departure by 30 minutes can shift a motorcade out of a documented high-risk window.
Step 6: Route Documentation and Team Briefing
Every finalized route needs to be documented and distributed before movement begins. That documentation typically includes linear route cards, digital map packages annotated with threat data, and a briefing document shared with the security advance party (SAP) and driving team on a need-to-know basis.
Documentation is not paperwork for its own sake. It allows a team member unfamiliar with the route to execute it correctly, and it is the record an EP program relies on if a route decision is ever questioned. Standardized templates keep this step consistent across every operation.
Step 7: Dynamic Re-Routing Protocols During Movement
Threat conditions can change after a route has been finalized and briefed, which is why EP teams need dynamic re-routing protocols for active movement. This is the point where real-time alert platforms like Dataminr and Everbridge earn their place in the workflow: they detect breaking events as they happen.
Security teams have noted that a real-time alert alone is not enough. An alert needs historical context to calibrate the response correctly. A single flagged incident on a route with a documented history of similar activity may warrant no change at all, while the same alert on a route with no such history should trigger an immediate reroute. Base Operations does not push real-time alerts. It supplies the historical baseline that gives an alert its meaning, working alongside a real-time platform rather than replacing one.
Executive Protection Route Planning Threat Data: Template and Format
An executive protection route planning threat data package should follow a consistent structure so any team member can execute it without missing a component:
- Mission Overview: principal, dates, destinations, and objectives for the movement
- Destination Threat Summary: baseline BaseScore and category breakdown for the destination city and district
- Primary Route Card: turn-by-turn route with threat data annotations at each segment
- Alternate Route Card: a fully independent secondary route, scored against the same data
- Choke Points and Danger Zones Log: every identified constriction point and elevated-risk segment along both routes
- Safe Haven Directory: validated hospitals, police stations, and secure facilities with 24-hour confirmation
- Time-of-Day Risk Profile: hourly and daily risk patterns relevant to the planned schedule
- Emergency Protocols: contact numbers, escalation paths, and rendezvous instructions
- After-Action Review: a section reserved for post-movement notes that feed the next assessment
Populating this template manually across multiple platforms can consume hours per trip. Base Operations customers generate the destination threat summary, route card annotations, and time-of-day risk profile directly as exportable reports, keeping the format consistent without adding manual research time to every trip.
Executive Protection Route Planning Threat Data: Sample and Examples
Consider how a data-driven process plays out for a senior executive traveling to Mexico City for a two-day series of meetings.
City baseline. The team pulls a BaseScore for Mexico City and the specific districts on the itinerary, then breaks it down by district and threat category to see where risk concentrates.
Location analysis. For the hotel and each meeting venue, the team runs a street-level heat map at a 0.1-mile radius. Two hotels a few blocks apart in the same district can show materially different risk profiles once broken down by category and by block.
Route scoring. With locations assessed, the team drafts a primary route between the hotel and the first venue, then an alternate. Each gets scored against the same threat data layers. Rather than concluding "avoid downtown," the data shows a specific corridor displays favorable patterns compared to nearby alternatives, letting the team keep a direct, efficient route instead of defaulting to a longer detour.
Choke point identification. The route passes through one unavoidable single-lane underpass. That segment gets logged as a choke point requiring a documented mitigation plan.
Time-of-day adjustment. Data shows elevated property crime in the hotel district during specific evening hours, so the team schedules the return leg of the trip to avoid that window where the agenda allows.
Final recommendations. The completed package: a primary route, an alternate, one flagged choke point, a scheduling adjustment, and a safe haven directory, all documented and briefed to the driving team before the principal lands. That is what a data-driven route planning process produces: a defensible, specific plan instead of a generic destination advisory.
Threat Data Tools and Platforms for EP Route Planning
EP teams typically work across four distinct categories of platforms, each built for a different function in the route planning workflow, not a single all-in-one tool.
Real-time alerting platforms, such as Dataminr, Everbridge, and AlertMedia, detect breaking events as they happen and are built for speed. GIS mapping platforms like Esri and ArcGIS provide general-purpose geospatial visualization for plotting route geometry. Dark web and extremist-monitoring platforms like Flashpoint track targeted threats against a specific principal; Base Operations does not offer this capability and positions itself as complementary to it. EP-specific case management platforms, including Ontic, Global Guardian, and International SOS, centralize protective intelligence workflows and incident documentation.
Base Operations sits in a fifth category: street-level pre-trip threat intelligence, supplying the baseline risk scoring and historical pattern data that inform route decisions before movement begins.
How Base Operations Provides Threat Data for EP Route Planning
Base Operations maps directly onto the seven-step process outlined above. BaseScore delivers the baseline threat assessment at the city, district, and 0.1-mile radius level, so teams can move from a citywide number to a specific corridor in the same platform. Heat maps at that same sub-mile resolution support choke point and danger zone analysis, and time-of-day breakdowns feed directly into scheduling decisions. Crime data refreshes monthly and unrest data refreshes bi-weekly, keeping every layer current. Exportable PDF reports and BaseFusion, which layers internal incident data alongside external threat data, support the documentation step. The API delivers all of this programmatically, so teams can pull BaseScore and route corridor data directly into their own systems.
This is not a theoretical framework. A national pharmacy retail chain used sub-mile resolution data to deliver EP threat assessments three times faster, saving more than 37 hours across a 45-day period, with heat maps that let drivers and protection teams quickly understand neighborhood-level risk variation.
A Fortune 500 travel company applied the same approach across more than 300 locations in a single year, moving from country-level geopolitical analysis to granular, corridor-specific reporting and generating roughly $25,000 in annual cost savings.
A global third-party logistics provider scaled its route security analysis fourfold while cutting assessment costs 75%, using the same corridor-level scoring approach applied here to executive routes.
For EP teams still running this process across spreadsheets and generic maps, the fastest way to see the difference is a working demo. Schedule a demo to see how BaseScore and BaseFusion apply to your footprint and travel patterns.
Executive Protection Route Planning Threat Data: PDF Resources and Documentation
A complete executive protection route planning threat data PDF package brings every component of the process into a single, shareable document: a destination threat summary, annotated primary and alternate route cards, choke point and danger zone maps, a safe haven directory, time-of-day risk charts, and emergency contact protocols.
The value of a PDF package is portability. A driving team member without platform access still needs the full picture before a movement begins, and a shared document is often faster to reference in the field than a live dashboard. Base Operations customers generate these reports directly from the platform, pulled from the same BaseScore and heat map layers used during planning, so the PDF reflects the same figures the route was scored against.
Teams that want to see this in practice can schedule a demo and request a sample report built around a destination relevant to their own travel patterns.
Free Resources and Open-Source Threat Data for EP Route Planning
Free threat data resources exist, and EP teams should not dismiss them. OSAC publishes country and regional security reports at no cost to eligible organizations. The U.S. State Department issues travel advisories. Many local police departments publish crime maps, and Google Maps remains a default reference for basic navigation.
The limitation is granularity and timeliness, not existence. Free resources tend to report at the country or city level, updated on an annual or irregular cycle, without the neighborhood-level precision or time-of-day breakdown route planning requires. One recurring pattern security analysts describe: pulling up Google Maps next to a security platform just to understand why a particular address shows elevated risk, only to discover a courthouse or transit hub nearby that a generic map never flagged. Annual data cycles create a similar gap: police response time data is often not fully updated until well into the following year, meaning an assessment built entirely on free sources can be working from information that is already stale by the time it informs a route decision.
Free resources have a role in the process. They are not built to carry the weight of a full route planning decision on their own.
Executive Protection Plan Sample: Route Planning Section
A route planning section within a broader executive protection plan typically mirrors the checklist template above, formatted for inclusion in the plan's overall document. A representative outline:
- 4.1 Destination Threat Overview: baseline risk scoring for the destination city and district
- 4.2 Primary Route: turn-by-turn detail with annotated threat data
- 4.3 Alternate Route: independently scored secondary path
- 4.4 Choke Points and Danger Zones: identified constriction points and elevated-risk segments
- 4.5 Safe Havens and ERVs: validated facilities along the route
- 4.6 Time-of-Day Considerations: scheduling notes tied to temporal risk data
- 4.7 Communication Protocols: driver, advance team, and principal communication chain
EP programs that align this section to recognized frameworks, including ASIS International guidance and standard advance work checklists, give the document more weight when it needs review by security leadership or legal counsel. The route planning section should never stand alone: it connects backward to the destination threat assessment and forward to the emergency protocols section, so a reviewer can trace every route decision back to the data that produced it.
Executive Protection Policy: Integrating Route Planning Requirements
Codifying route planning into formal EP policy turns a good practice into an organizational requirement that survives staff turnover. At minimum, a policy should specify the minimum threat assessment required before any principal movement, whether a full route planning package for international travel or an abbreviated version for routine local movement.
Approval thresholds tied to risk score give the policy teeth. A route scoring within a normal range for that principal's baseline might require standard sign-off, while a route crossing a defined risk threshold could require senior security leadership approval before movement proceeds. This gives security teams a data-backed answer when leadership asks why a route needs additional review time, replacing a subjective judgment call with a documented score.
Documentation retention and escalation protocols round out the policy: how long route assessments are kept on file, who reviews them after an incident, and what triggers a policy review. With 85% of security leaders reporting rising physical threats to executives, a formal policy is no longer optional. It is the mechanism that makes route planning defensible and consistent across every EP program, regardless of which analyst or driver is on duty.
Common Failures in EP Route Planning (And How Threat Data Fixes Them)
Even experienced EP teams fall into predictable patterns that threat data is specifically built to correct.
1. Relying on generic travel advisories instead of street-level data. A country or city-level advisory cannot tell a team which specific corridor near a hotel carries elevated risk. Teams that make the shift move from a blanket "avoid downtown" judgment to a specific, corridor-level recommendation.
2. Treating route planning as a one-time pre-trip exercise. A route assessed once, weeks before a movement, can be working from stale information by the time the principal travels. A route plan needs the same update cadence as the underlying data.
3. Failing to account for time-of-day crime patterns in scheduling. Violent and property crime peak at different points across a day. A route scored without a time-of-day breakdown looks safe on paper while carrying real elevated risk during the specific hours a movement is scheduled.
4. Siloed physical and digital threat monitoring. Teams that run physical threat data and digital monitoring through separate tools miss the connection between a targeted online threat and the physical route it points toward. A doxxing post that names a hotel is a route planning input, not just a digital security concern.
5. Lack of documented alternate routes and emergency rendezvous points. A single planned route with no validated alternate leaves a team with no good option if that route becomes compromised mid-movement. Every package needs at least one independently scored alternate and a directory of validated safe havens.
Frequently Asked Questions
What threat data should be included in an executive protection route plan?
An executive protection route plan should layer five categories of threat data: street-level crime data at 0.1 to 0.2 mile resolution, civil unrest and protest intelligence, geopolitical and travel risk context from sources like OSAC, real-time traffic and infrastructure data covering closures and road conditions, and digital or social media threat signals that can indicate a targeted threat. No single category is sufficient on its own. A route plan layering all five gives a security team a complete picture of both ambient risk (general crime and unrest patterns) and targeted risk specific to the principal or trip.
How often should route threat assessments be updated?
Route threat assessments should be treated as living documents, not one-time deliverables. Baseline crime and threat data should refresh on at least a monthly cycle, since annual-only sources, common among free government resources, can be updated as much as a year behind current conditions. For any specific movement, teams should pull a fresh baseline shortly before the trip rather than relying on data gathered months earlier, and combine that baseline with real-time alert monitoring during the movement itself.
What is the Zone of Total Predictability in EP route planning?
The Zone of Total Predictability is a concept from the International Security Driver Association, associated with security trainer Steve Powers, describing any route segment where a principal must travel a specific, fixed path with no available alternative. A single-lane bridge, a gated community's sole entrance, and a hotel's one loading dock are all examples. These zones matter because they eliminate route variance entirely, giving an adversary a guaranteed location. EP teams cannot always eliminate these zones, but they can identify them in advance and build specific mitigation plans around each one.
How is EP route planning threat data different from a standard GPS route?
A standard GPS route optimizes for time and distance: it finds the fastest or shortest path between two points and has no concept of crime rates, civil unrest, or choke points. Executive protection route planning threat data optimizes for a different variable: exposure. It evaluates each potential route against layered threat data, including street-level crime patterns, civil unrest activity, and choke point locations, to identify the path that minimizes a principal's exposure to predictable risk, even if that path is not the fastest option a mapping app would suggest.
What accuracy or granularity does street-level threat data provide for routes?
Street-level threat data for route planning typically resolves to a 0.1 to 0.2 mile radius, sometimes described as sub-mile precision, granular enough to differentiate risk block by block rather than across an entire neighborhood or city. EP teams consistently describe this as a requirement for route planning, since two streets separated by only a few blocks can carry meaningfully different threat profiles. City or district-level averages can obscure exactly the kind of localized risk variation that determines whether a route segment is safe to use.
How do EP teams use threat data during active principal movement?
During active movement, EP teams rely on real-time alert platforms like Dataminr or Everbridge to flag breaking incidents such as a demonstration forming or an accident blocking a planned route. A real-time alert is most useful when paired with historical context: knowing whether a flagged incident is unusual for that location helps a team calibrate whether the situation calls for an immediate reroute or continued monitoring. This is why dynamic re-routing protocols combine a real-time detection layer with the historical threat baseline established during pre-trip planning.
Can threat data for EP route planning be accessed via API?
Yes. Threat intelligence platforms built for route planning, including Base Operations, offer REST API access to risk scoring and threat category data, letting security teams pull route corridor and location-level information directly into their own systems, dashboards, or case management platforms. API access is particularly useful for EP programs that want to integrate threat data into an existing workflow, or that need to trigger internal review processes automatically when a route's risk score changes.
What is a route planning threat data template for executive protection?
A route planning threat data template is a standardized document structure ensuring every EP route assessment covers the same essential components: a mission overview, a destination threat summary, primary and alternate route cards annotated with threat data, a choke point and danger zone log, a safe haven directory, a time-of-day risk profile, emergency protocols, and an after-action review section. Using a consistent template across every movement makes assessments comparable over time and ensures no team member skips a critical step, regardless of experience level or how routine a trip may seem.
Route planning is where protective intelligence becomes an operational decision. Teams that build their process on layered, current threat data are the ones that can defend every route they choose. Schedule a demo to see how Base Operations' street-level threat intelligence fits your executive protection program.
Takeaways

Join 1100+ security leaders getting new ideas on how to better protect their people and assets.