
How to Prioritize Security Resources Across Multiple Locations
Data-driven framework for allocating finite security budgets across location portfolios using threat intelligence, asset value, and security posture evaluation.

Who this is for: Corporate Security Directors managing multi-site portfolios • Problem: Finite budget cannot cover all locations equally • Outcome: Data-driven resource allocation that prevents incidents at high-risk sites
"We have a finite number of resources. We gotta prioritize them somehow."
That single sentence, spoken by an enterprise security director during a recent strategy session, captures the defining challenge every multi-location security team faces. You've got 100 locations. Budget for 50. And every regional manager insists their site is the priority.
The stakes are career-defining. Deploy guards to the wrong locations, and preventable incidents occur at the sites you didn't protect. Overspend on low-risk areas, and executives question your judgment when budget constraints force cuts. Make arbitrary allocation decisions, and you'll have no defensible rationale when a board investigation asks why resources weren't where they were needed most.
This guide provides the risk-based prioritization framework that enterprise security teams use to allocate finite resources across location portfolios, combining threat intelligence, asset value assessment, and security posture evaluation into defensible, data-driven decisions.
Why "Gut Feel" Resource Allocation Fails at Scale
When you manage 5 locations, intuition works. You know each site. You've walked the properties. You understand the neighborhoods. But at 50 locations? At 500? Gut feel becomes arbitrary decision-making disguised as expertise.
The reality playing out across corporate security teams reveals four failure patterns when resource allocation lacks objective methodology:
Political pressure overrides risk assessment. The regional VP demands guards at their flagship location because it's "strategically important," even though actual threat data shows it sits in a low-crime district. Meanwhile, a high-risk distribution center in a dangerous corridor operates with minimal security because it lacks a vocal advocate. Security decisions become negotiation outcomes rather than risk-based allocations.
Recency bias drives reactive reallocation. A retail store experiences a theft incident, so resources flood that location for three months, long after the underlying threat environment has normalized. Other locations with elevated baseline risk remain under-resourced because they haven't had a recent incident yet. Teams chase the last problem instead of preventing the next one.
Stakeholder complaints consume attention. Store managers who call corporate security most frequently get the most resources, regardless of actual threat levels. The security team's allocation methodology becomes "respond to whoever yells loudest" rather than "protect based on objective risk." This isn't strategic security management. It's organizational squeaky wheel maintenance.
Post-incident justification is impossible. When an incident occurs at an under-resourced location, executives ask: "Why didn't we have adequate security there?" Without documented risk assessment and prioritization rationale, the security director has no defensible answer. "We thought other locations were higher priority" doesn't satisfy stakeholders when you can't explain why.
According to analysis of 39 customer insights from enterprise security teams, the prioritization struggle centers on one fundamental gap: no objective criteria for making allocation decisions. Teams know they need to prioritize. They lack the framework and data to do it defensibly.
The Cost of Getting Prioritization Wrong
Resource misallocation doesn't just waste budget. It creates compounding organizational costs that damage security effectiveness and career prospects:
Preventable security incidents at high-risk locations. The cost of a single armed robbery, workplace violence incident, or catastrophic property crime typically exceeds $50,000 to $250,000+ when you factor in business interruption, legal liability, employee trauma, and brand damage. When these incidents occur at locations that objective risk assessment would have identified as high-priority but received minimal security due to arbitrary allocation, the financial and reputational costs are entirely preventable.
Wasted security spending at low-risk locations. A full-time security guard costs $45,000 to $65,000 annually. Deploy three guards to a flagship location in a safe suburban area with low incident history and minimal threat intelligence, while high-risk urban locations operate with reduced coverage, and you're burning $135,000 to $195,000 per year on protection that delivers minimal risk reduction. This isn't security budgeting. It's security theater.
Stakeholder trust erosion through arbitrary decisions. When regional managers realize security resource allocation follows political influence rather than objective risk criteria, they lose confidence in the corporate security function's strategic judgment. Security becomes viewed as a reactive cost center that responds to pressure rather than a proactive risk management partner that prevents incidents. This perception shift is difficult to reverse.
Career risk in post-incident reviews. The most personal consequence: When a serious incident occurs at an under-protected location, the security director faces board-level scrutiny. "Why did Location A have three guards when the incident happened at Location B with minimal coverage?" If your answer is "Location A's VP demanded more security" or "We didn't have data to compare risk levels," your credibility, and potentially your role, is finished. Arbitrary allocation decisions create career liability.
According to enterprise security budget analysis, misallocated resources typically represent 20-30% of total security spending. For an organization with a $5 million security budget, that's $1 million to $1.5 million per year deployed to locations where it delivers minimal risk reduction while higher-risk sites remain vulnerable.
The Risk-Based Resource Prioritization Framework
Effective security resource allocation requires a systematic framework that combines three critical factors into a defensible priority score:
Priority Score = (Threat Environment × Asset Value) / Current Security Posture
This formula operationalizes how enterprise security teams actually make allocation decisions. High-threat locations with high-value assets and minimal existing security score highest priority. Low-threat locations with lower asset values and robust existing security score lowest priority. The framework enables apples-to-apples comparison across entirely different types of locations.
Breaking down each component:
Factor 1: Threat Environment (BaseScore 0-100) measures the external risk landscape surrounding each location. This includes crime rates, civil unrest patterns, environmental hazards, and other location-specific threats. The key is hyperlocal granularity, understanding threat levels at the specific address, not just the city average. Two retail stores 3 miles apart in the same metropolitan area might have BaseScores of 72 (high risk) and 38 (low risk), requiring completely different security strategies.
Factor 2: Asset Value (Normalized 0-100) quantifies what you're protecting beyond simple revenue numbers. A flagship retail store with $2 million annual revenue might warrant higher protection than a $5 million distribution center if the flagship location houses executive offices, represents significant brand exposure, and serves as a regional hub. Asset value encompasses financial assets, human capital, strategic importance, and brand exposure.
Factor 3: Current Security Posture (Normalized 0-100) evaluates existing protection measures already deployed at each location. A site with 24/7 guard coverage, comprehensive CCTV, access control systems, and hardened perimeter has high current security. A site with basic alarms and part-time security has low current security. This factor prevents double-allocation, ensuring locations already well-protected score lower priority for additional resources.
The division operation is deliberate. Higher existing security posture reduces incremental priority. A high-threat, high-value location with minimal current security generates the highest priority score. That same high-threat, high-value location with robust existing security generates lower priority because marginal additional resources deliver less risk reduction.
This framework provides the foundation for every allocation decision. Instead of subjective judgments about which locations "feel" important, you have quantifiable priority scores that rank every location from highest to lowest need. The methodology is transparent, defensible, and updateable as conditions change.
Factor 1: Assessing Threat Environment with Hyperlocal Intelligence
The critical weakness in most security resource allocation: reliance on city-level or district-level crime statistics that hide dramatic hyperlocal variation. A metropolitan area's overall crime rate tells you nothing about whether the specific street corner where your facility sits is high-risk or low-risk.
Consider two retail locations in the same city, separated by only 3 miles. City-level data suggests both face similar threat environments. But hyperlocal analysis reveals reality:
Allocating the same security resources to both locations ignores this 34-point BaseScore difference. Location A requires enhanced guard coverage, comprehensive surveillance, and after-hours protocols. Location B can safely operate with technology-focused security and reduced guard hours.
Base Operations' BaseScore methodology provides the granular threat intelligence this framework requires: risk scoring at the specific address level using H3 grid system coverage (~1-mile radius) that aggregates data from 25,000+ global sources. This enables true apples-to-apples risk comparison across locations in different cities, states, and countries.
The standardized 0-100 BaseScore enables portfolio-wide comparison regardless of location type or geography. You can directly compare the threat environment at a retail store in Philadelphia (BaseScore 65) against a distribution center in Phoenix (BaseScore 42) against a corporate office in Austin (BaseScore 38). This comparison is impossible with city-level crime statistics alone.
Critical implementation point: Threat assessment must incorporate multiple risk categories beyond crime. BaseScore methodology evaluates:
Multi-category threat scoring prevents blind spots. A location might have low violent crime but high civil unrest risk. Another might have moderate property crime but severe weather vulnerability. Comprehensive threat assessment captures all risk dimensions relevant to security resource allocation.
Factor 2: Quantifying Asset Value Beyond Revenue
Revenue is an obvious metric for asset value assessment, but it's incomplete. A $10 million-revenue distribution center might warrant less security investment than a $3 million-revenue flagship retail location if the flagship houses executive offices, generates significant brand exposure, and serves as a regional training hub.
Enterprise security teams use a multi-dimensional asset value matrix:
Financial Assets:
Human Capital:
Brand Exposure:
Strategic Importance:
To normalize asset value across heterogeneous location types, assign 0-100 scores for each dimension, apply business-specific weights, and calculate composite asset value. Example weighting:
A flagship retail store might score:
A distribution center might score:
Despite the distribution center's higher financial value, the flagship store's superior brand exposure and human capital factors drive similar overall asset value scores, which explains why both warrant significant security investment despite different financial profiles.
The key insight: Asset value must reflect organizational priorities. A hospitality company might weight brand exposure at 40% because reputation drives bookings. A manufacturing company might weight strategic importance at 40% because production continuity is paramount. The framework adapts to business context.
Factor 3: Evaluating Current Security Posture and Vulnerability
The final prioritization factor, current security posture, prevents the classic mistake of over-allocating resources to locations that already have robust protection while under-protecting vulnerable sites.
Security posture assessment examines four dimensions:
Physical Hardening (0-100 score):
High physical hardening means attackers face significant barriers even without active security presence. Low physical hardening means the facility is inherently vulnerable, requiring more guards and technology to compensate.
Personnel Deployment (0-100 score):
Locations with comprehensive guard coverage and professional security staff score high. Locations with no guard presence or minimal coverage score low.
Technology Infrastructure (0-100 score):
Technology creates force multipliers. One remote monitoring operator can oversee multiple locations. High technology infrastructure enables effective security with reduced on-site personnel. Low technology infrastructure requires more human resources to achieve equivalent coverage.
Operational Factors (0-100 score):
Operational factors affect inherent vulnerability. A 24/7 location with high traffic and cash handling requires more security than a daytime-only location with card-only transactions.
To calculate composite current security posture, normalize each dimension to 0-100, apply weighting based on effectiveness, and calculate the weighted average:
Why security posture divides rather than subtracts in the priority formula: This creates the correct prioritization dynamics. A location with high threat (BaseScore 70) and high asset value (75) but also high current security (80) generates priority score of (70 × 75) / 80 = 65.6. That same location with low current security (30) generates priority score of (70 × 75) / 30 = 175. The under-protected location scores almost 3x higher priority because additional resources deliver greater marginal risk reduction.
Putting It Together: Building Your Location Priority Scorecard
With threat environment, asset value, and security posture quantified, you can now build a comprehensive location priority scorecard that ranks every site in your portfolio:
Step 1: Gather Threat Data for Each Location
Use Base Operations to obtain BaseScore for every location's specific address. Export the My Locations dashboard showing all sites ranked by threat level. This provides the first factor for your priority formula.
For the priority calculation walkthrough, let's evaluate three sample locations:
Location Alpha (Flagship retail store, downtown metro area):
- BaseScore: 72 (high risk, elevated property crime, moderate violent crime)
Location Beta (Suburban retail store, residential district):
- BaseScore: 38 (low risk, minimal property and violent crime)
Location Gamma (Distribution center, industrial corridor):
- BaseScore: 55 (moderate risk, moderate property crime, low violent crime)
Step 2: Score Asset Value Using Multi-Dimensional Matrix
Apply your asset value framework to each location:
Location Alpha asset value:
Location Beta asset value:
Location Gamma asset value:
Step 3: Assess Current Security Posture
Evaluate existing protection measures at each location:
Location Alpha security posture:
Location Beta security posture:
Location Gamma security posture:
Step 4: Calculate Priority Scores
Apply the framework formula:
Location Alpha: (72 × 68) / 63 = 77.7 priority score
High threat environment combined with flagship status and moderate existing security generates high priority for additional resources.
Location Beta: (38 × 38) / 40 = 36.1 priority score
Low threat environment, lower asset value, and minimal existing security still generates low overall priority because threat level is inherently low.
Location Gamma: (55 × 62) / 78 = 43.7 priority score
Moderate threat with high asset value but robust existing security generates moderate priority. Additional resources deliver diminishing returns at this already well-protected site.
Step 5: Rank All Locations and Overlay Budget Constraints
Create a complete portfolio ranking:
With budget constraints covering only top-priority locations, allocate resources systematically:
Step 6: Document Rationale for Stakeholder Communication
For each location, your scorecard now provides defensible documentation:
This documentation transforms resource allocation from subjective judgment to evidence-based decision-making that stakeholders can understand and challenge on data rather than politics.
Step 7: Monitor and Update Quarterly
Security risk isn't static. BaseScore changes as crime patterns shift. Asset values change as business priorities evolve. Security posture changes as you deploy new technology or adjust guard coverage. Re-run your priority scorecard quarterly to ensure resources remain aligned with current conditions.
Real-World Example: How a Top 25 Retailer Allocates Guard Force Across 8,500+ Sites
When you manage security for 8,500+ retail locations, equal distribution is impossible. Budget constraints mean tough choices: Which stores get security guards? How many? During which hours? Get these decisions wrong, and incidents occur at under-protected high-risk stores while low-risk stores waste budget on unnecessary coverage.
A top 25 discount retailer faced this exact challenge. Store managers across the portfolio demanded security coverage. Regional Vice Presidents advocated for their territories. But the corporate security team knew they couldn't deploy guards everywhere. They needed objective prioritization methodology.
The Challenge: Political Pressure Without Objective Criteria
Before implementing risk-based allocation, the retailer's guard force deployment followed a problematic pattern:
This allocation approach created two problems: preventable incidents at under-protected high-risk stores, and wasted security spending at low-risk stores where guards delivered minimal value.
The Solution: BaseScore-Driven Guard Force Allocation
The security team implemented the risk-based prioritization framework:
The Results: Data-Driven Allocation Delivering Measurable Impact
The risk-based allocation approach delivered quantifiable outcomes:
Perhaps most importantly: When the CEO asked "Why does Store A have two guards while Store B has none?" the corporate security director had a one-page briefing with BaseScore data, asset value comparison, and priority score calculation. The answer wasn't "Store A's VP demanded more security." The answer was "Store A's threat environment (BaseScore 78) and asset value (85) generate priority score of 98, while Store B's threat environment (BaseScore 32) and asset value (45) generate priority score of 36. We deployed resources to prevent incidents at the highest-risk locations."
This is the power of risk-based resource prioritization: transforming political negotiation into strategic risk management.
Learn more: How a Top 25 Retailer cut incidents by 75% with risk-based resource allocation
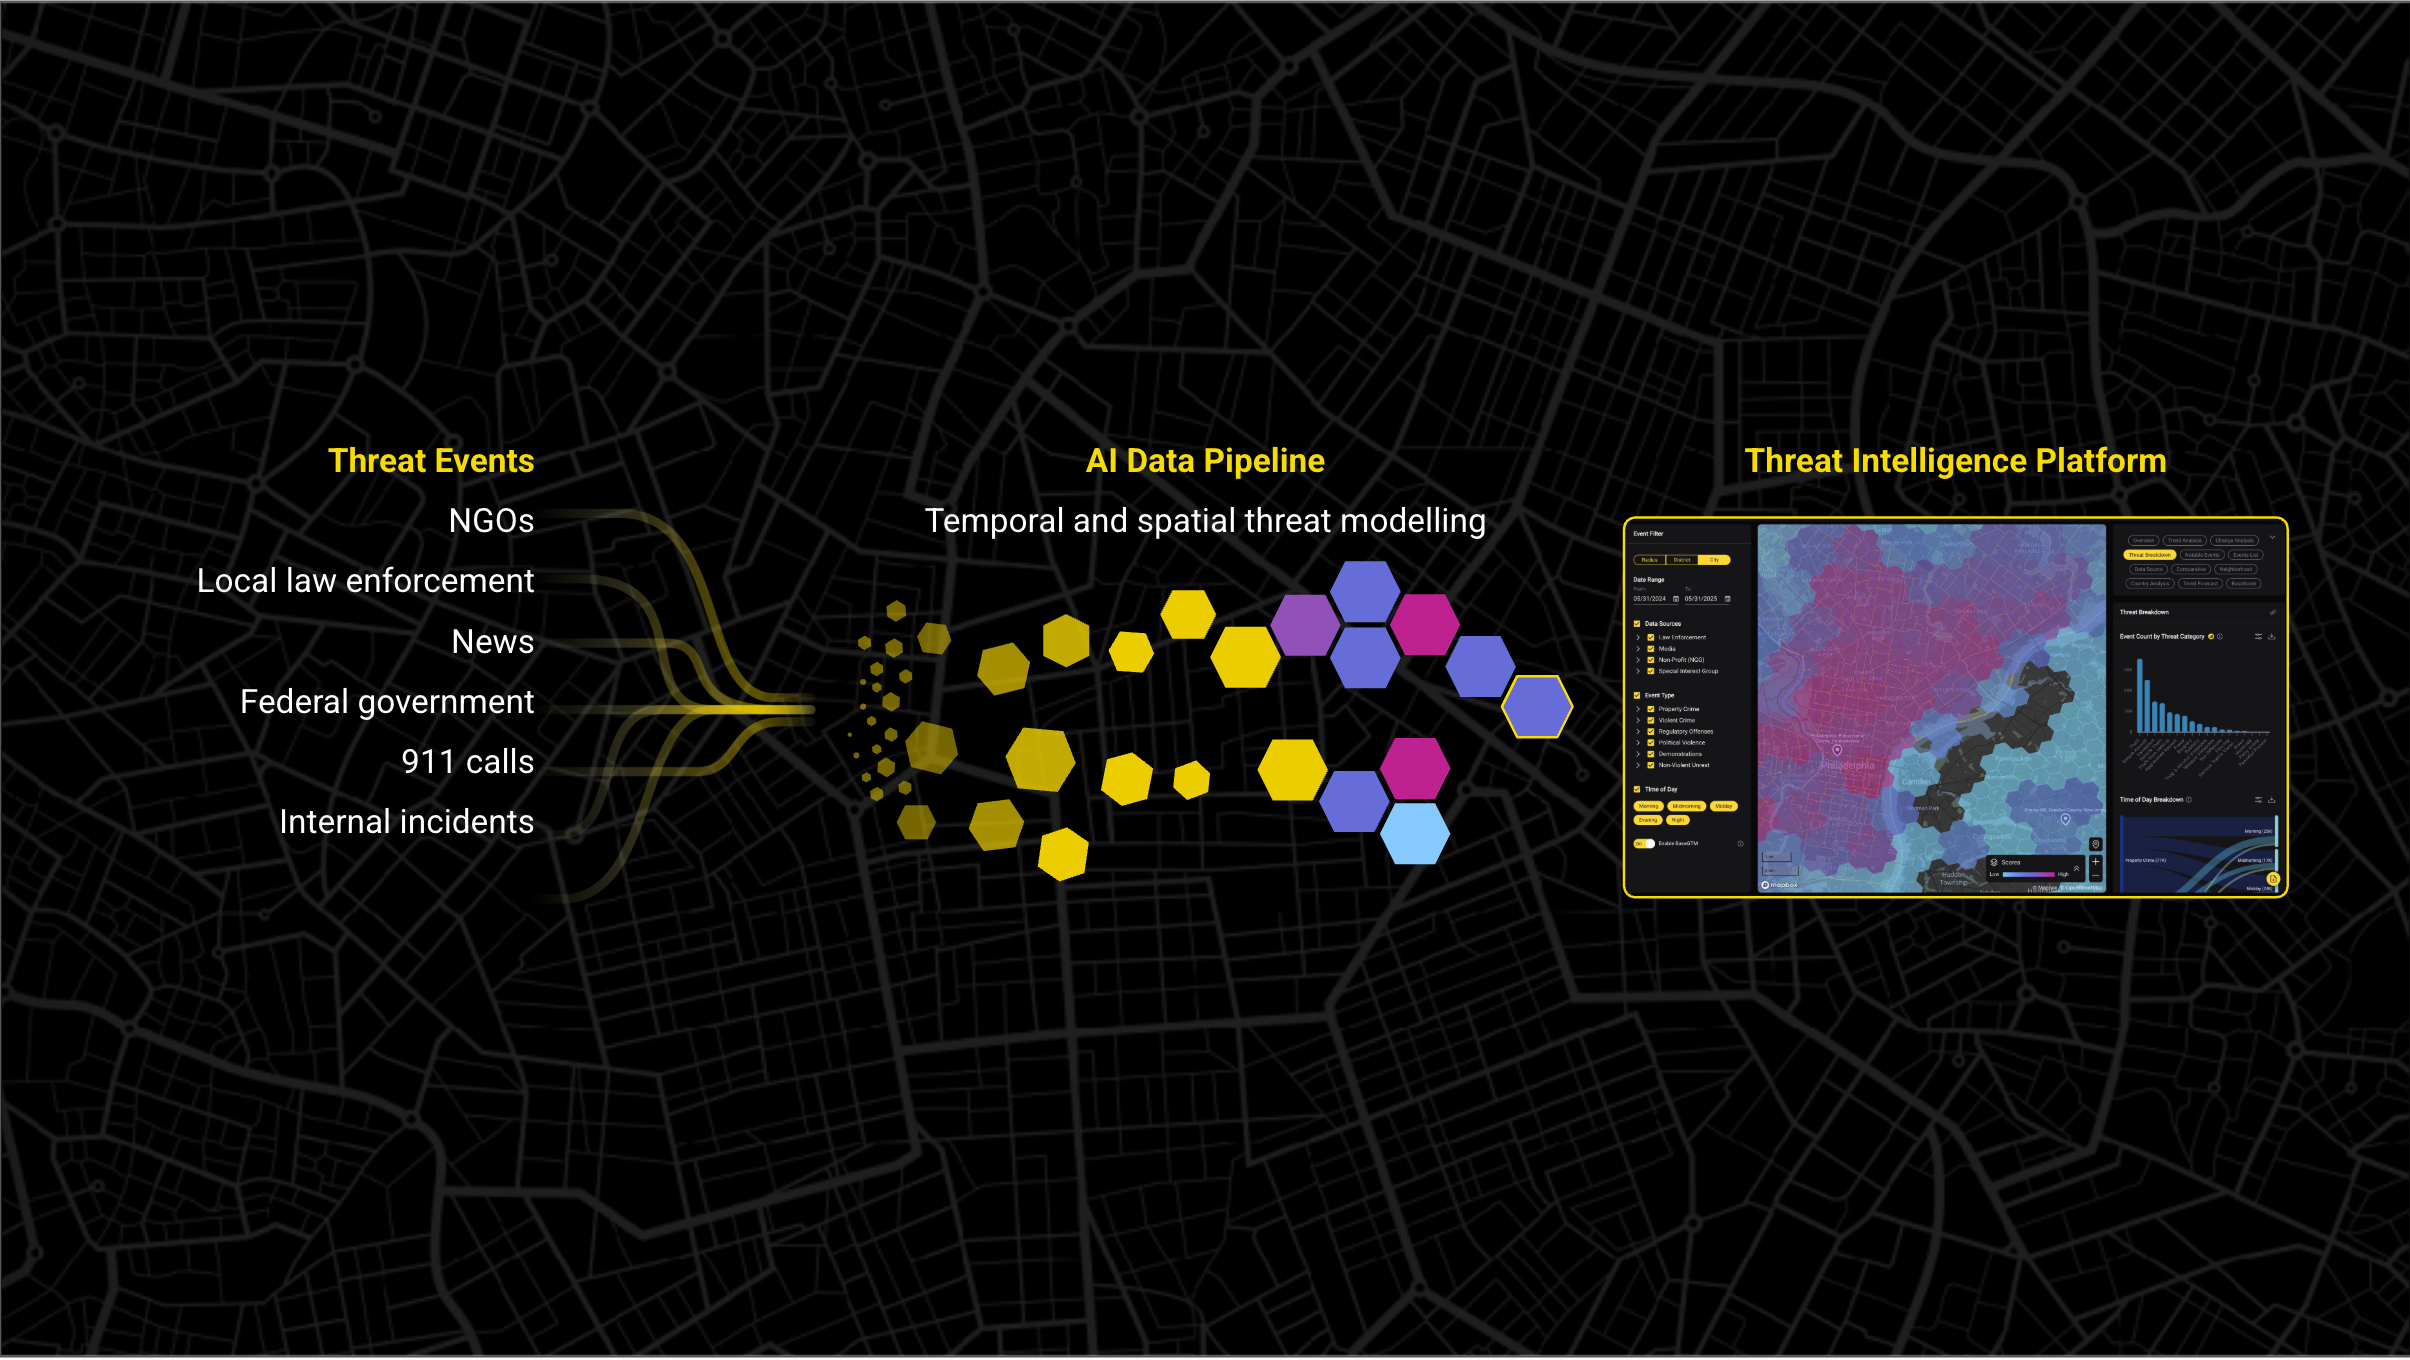
How Base Operations Provides the Threat Intelligence Layer
The resource prioritization framework requires one critical input that security teams traditionally struggle to obtain: consistent, accurate, hyperlocal threat intelligence for every location in their portfolio.
Manually researching crime data for 50 locations is time-consuming. For 500 locations, it's impractical. For 8,500 locations, it's impossible. Base Operations solves the threat intelligence scalability problem:
BaseScore for 5,000+ Cities Globally: Instant threat assessment for locations in any major metropolitan area worldwide. No manual research required. No data collection from disparate municipal sources. Launch the platform, add your locations, and receive standardized BaseScore risk ratings immediately.
Sub-Mile Granularity with H3 Grid System: Address-level risk profiles, not city averages that hide critical variation. Two stores 3 miles apart might have dramatically different BaseScores based on their specific neighborhood threat environments. This granularity enables true apples-to-apples comparison for resource allocation. You're comparing actual threat levels at specific addresses, not broad geographic regions that obscure local risk.
Monthly Automated BaseScore Updates: Threat environments change. Crime patterns shift. Civil unrest emerges. Environmental risks evolve. Base Operations provides monthly automated BaseScore updates so your threat intelligence remains current without analyst effort. Priority scores stay aligned with real-world conditions.
My Locations Dashboard for Portfolio Overview: At-a-glance visualization of all locations ranked by BaseScore, with monthly change tracking to identify threat increases requiring security response. Filter by region, sort by risk level, export priority rankings for resource allocation planning. The dashboard provides the infrastructure for systematic prioritization instead of location-by-location manual assessment.
API Integration for Unified Risk View: Connect BaseScore threat intelligence to your asset management systems, security platforms, and risk dashboards. Automate priority score calculation by pulling BaseScore data directly into your resource allocation workflows. Eliminate manual data transfer and enable real-time prioritization updates.
Automated Alerting for Significant Changes: When BaseScore increases significantly at any location (indicating threat environment deterioration), automated alerts trigger re-prioritization reviews. Your security team doesn't monitor threat data manually. The platform monitors it for you and notifies you when allocation decisions should be reconsidered.
The operational efficiency impact: Instead of security analysts spending 15-20 hours per week manually researching threat data for portfolio locations (as documented in enterprise security workflow analysis), Base Operations delivers that intelligence instantly and keeps it current automatically. Analysts redirect their bandwidth from data collection to strategic allocation planning, the high-value work that actually prevents incidents.
Prioritize security spending with data-driven threat intelligence. See how Base Operations BaseScore ranks your entire location portfolio by risk for optimal resource allocation. Request a demo to calculate priority scores for your sites.
Communicating Prioritization Decisions to Stakeholders
Having objective priority scores solves only half the resource allocation challenge. The other half: communicating allocation decisions to stakeholders who disagree with their location's tier assignment.
Regional managers believe their territories deserve more security. Store managers argue their locations are "high priority" regardless of data. Executives question why flagship locations receive different coverage than regional stores. Without a clear stakeholder communication framework, even the most defensible allocation methodology faces political resistance.
The Stakeholder Management Framework:
1. Lead with Methodology, Not Conclusions
Begin stakeholder presentations by explaining the prioritization framework before showing individual location rankings. When stakeholders understand the three-factor model (threat × asset value / security posture) and agree it's a reasonable approach, they're more likely to accept their location's placement even if it's not what they expected.
Frame the methodology as "How we ensure security resources go where they'll prevent the most incidents" rather than "Why your location doesn't get guards." This positions the framework as strategic risk management, not budget rationing.
2. Show the Math with Transparent Inputs
For each location, provide stakeholders with the complete priority score calculation:
Transparency enables productive disagreement. If a regional manager believes their location's asset value is underestimated, they can provide specific evidence (actual revenue numbers, foot traffic data, strategic importance justification). This is constructive debate about inputs, not political argument about conclusions.
What they cannot do: Argue that "my location just feels like it should be higher priority." Subjective feelings don't change objective data.
3. Visualize the Portfolio with Risk Heat Maps
Create visual representations showing the entire location portfolio color-coded by priority score:
Geographic heat maps immediately reveal patterns: clusters of high-priority locations in urban metro areas, dispersed low-priority locations in suburban/rural areas, moderate-priority locations in mixed-use districts. Stakeholders see their location in portfolio context, not in isolation.
4. Provide Industry Benchmarks and Historical Context
Support allocation decisions with external validation:
Industry benchmarks and historical incident correlation demonstrate that your prioritization framework aligns with security best practices and your organization's actual experience.
5. Build Feedback Loops for Input Challenges
Invite stakeholders to challenge specific inputs in the priority calculation, but not the methodology itself:
This feedback loop converts objections into data refinement. Stakeholders become partners in improving allocation accuracy rather than adversaries arguing for more resources.
Example Executive Presentation: One-Slide Priority Scorecard
When the CEO asks "How did you decide security resource allocation?" have a single slide ready:
Portfolio Security Resource Allocation
Methodology: Risk-based prioritization using threat intelligence (BaseScore), asset value, and existing security posture
Coverage: 100 locations ranked by priority score
Allocation Strategy:
Expected Outcome: 75% reduction in incidents at Tier 1 locations (based on similar portfolio case study)
Data Source: Base Operations BaseScore threat intelligence + internal asset value scoring + security posture audits
One slide. Objective methodology. Clear allocation tiers. Expected results. Defensible data sources. This is how you transform resource allocation from political negotiation into strategic presentation.
Continuous Re-Prioritization: Adapting to Changing Conditions
Resource allocation isn't a one-time decision. It's an ongoing process that adapts to evolving threat environments, business changes, and security infrastructure improvements.
The continuous re-prioritization approach:
Monthly Threat Updates with Automated BaseScore Refreshes: Base Operations provides monthly automated BaseScore updates reflecting current crime patterns, civil unrest conditions, and environmental risk levels. When BaseScore changes significantly at any location (increase of 10+ points indicates threat environment deterioration; decrease of 10+ points indicates improvement), automated alerts trigger re-prioritization reviews.
Example: A retail store's BaseScore increases from 42 to 58 over three months due to rising property crime in the surrounding district. The priority score recalculation moves this location from Tier 3 (technology-focused security) to Tier 2 (standard guard coverage), triggering resource reallocation to address the elevated threat.
Quarterly Asset Value Reviews for Business Changes: Business priorities evolve. New flagship locations open. Strategic facilities gain or lose importance. Employee headcount changes. Revenue performance shifts. Quarterly asset value reviews ensure priority scores reflect current business context, not outdated assumptions.
The review process: Security team meets with regional business leaders to update asset value scores based on Q1 business performance, strategic initiative progress, and organizational changes. Recalculate priority scores using updated asset values. Adjust resource allocation where business changes justify different security tiers.
Annual Security Posture Audits for Infrastructure Changes: Security infrastructure evolves as you deploy new technology, adjust guard coverage, implement physical hardening, or modify operational procedures. Annual security posture audits document these changes so priority scores reflect actual current security, not historical assessments.
The audit captures: Technology upgrades deployed during the year, guard force adjustments implemented, physical security enhancements completed, and operational protocol changes. Update security posture scores based on audit findings. Identify locations where security investments have improved posture sufficiently to reduce priority (freeing resources for reallocation to higher-need locations).
Event-Triggered Re-Prioritization for Major Incidents or Disruptions: Certain events require immediate priority recalculation regardless of scheduled review cycles:
Event-triggered reviews ensure allocation decisions remain aligned with current reality when circumstances change dramatically.
The Customer Workflow: Automated Alerts → Re-Run Prioritization → Adjust Resources
According to Case Study analysis, organizations using Base Operations for ongoing threat monitoring achieve 70% time reduction in maintaining current risk intelligence compared to manual research approaches. The workflow:
This workflow transforms continuous monitoring from analyst-intensive research into automated exception-based review. Analysts focus attention only on locations with significant changes, not routine monitoring across hundreds of stable locations.
The force multiplier effect: One security analyst can maintain current threat intelligence for 400+ global locations using Base Operations automation, compared to 50-100 locations using manual research approaches. This scalability enables enterprises to expand coverage without proportional headcount increases.
Learn more: How a Global 3PL scaled security monitoring to 441 cities with a team of 2
Conclusion: From Reactive Allocation to Strategic Resource Optimization
"We have a finite number of resources. We gotta prioritize them somehow."
That opening quote captures the fundamental reality: Security budgets cannot cover every location equally. The question isn't whether to prioritize. It's how to prioritize defensibly.
Security teams operating without objective methodology default to:
Security teams using the risk-based prioritization framework achieve:
The framework combines three critical factors:
Priority Score = (Threat Environment × Asset Value) / Current Security Posture
Where threat environment comes from hyperlocal BaseScore intelligence, asset value reflects multi-dimensional business importance, and current security posture accounts for existing protection measures.
The transformation: From subjective judgment to evidence-based strategy. From reactive reallocation to proactive optimization. From political negotiation to risk-based methodology. From career liability to career-enhancing strategic management.
Organizations implementing this framework, like the Top 25 Retailer achieving 75% incident reduction at 8,500+ prioritized locations, demonstrate that resource optimization isn't about doing more with less. It's about deploying finite resources where they'll have the greatest impact on preventing incidents and protecting assets, people, and operations.
The actionable next step: Start with threat assessment. Obtain BaseScore for every location in your portfolio. Build the asset value matrix and security posture assessment for your context. Calculate priority scores. Rank your locations. Allocate resources systematically.
Then communicate the methodology to stakeholders. Show them the math. Provide the portfolio visualization. Demonstrate how objective data drives allocation decisions.
This is how modern security teams transform from cost centers reacting to political pressure into strategic partners preventing incidents through intelligent resource optimization.
Start prioritizing with Base Operations threat intelligence. See how BaseScore ranks your entire location portfolio by risk, enabling data-driven guard force allocation and security resource optimization. Request a demo to begin building your priority scorecard.
Frequently Asked Questions
How do I justify security resource allocation decisions to executives who disagree?
Use the transparent three-factor framework: (1) Show BaseScore threat data proving location-specific risk levels, (2) Document asset value calculation with financial/brand/strategic dimensions, (3) Demonstrate current security posture assessment. Present priority scores with complete input transparency. Executives can challenge specific data points but not the methodology itself. One Fortune 500 security director achieved board-level buy-in by showing a one-page priority scorecard with BaseScore data, asset value matrix, and priority calculations for all locations. Key: Lead with methodology before showing individual rankings.
What's the right allocation strategy: equal distribution across all sites or concentrate resources at high-risk locations?
Risk-based concentration dramatically outperforms equal distribution. A Top 25 Retailer achieved 75% incident reduction by concentrating guards at high-priority locations (BaseScore 70+, high asset value) while deploying technology-only security at low-priority sites. Equal distribution wastes 20-30% of budget protecting low-risk locations that don't need expensive guard coverage while under-protecting high-risk sites where incidents actually occur. The framework formula (Threat × Asset Value / Current Posture) ensures resources go where they deliver maximum risk reduction.
How often should I recalculate location priority scores?
Monthly for threat updates (automated with Base Operations BaseScore refreshes), quarterly for asset value changes (business priorities evolve), annually for security posture audits (document infrastructure improvements), and immediately for major events (significant incidents, civil unrest, natural disasters). Customers using automated BaseScore monitoring achieve 70% time reduction vs. manual approaches. The platform alerts when significant changes require re-prioritization review rather than requiring continuous manual research.
Can small security teams really prioritize effectively across hundreds of locations?
Yes, through automation + framework. Base Operations provides instant BaseScore threat assessment for 5,000+ cities globally, eliminating manual research across jurisdictions. The priority formula provides objective ranking methodology. A Global 3PL monitors 441 cities with a team of 2 analysts. The key: Automate threat intelligence layer (Base Operations), systematize asset value scoring (internal framework), audit security posture annually, and focus analyst bandwidth on strategic allocation decisions and stakeholder communication, not data collection.
Takeaways

Join 1100+ security leaders getting new ideas on how to better protect their people and assets.

.png)