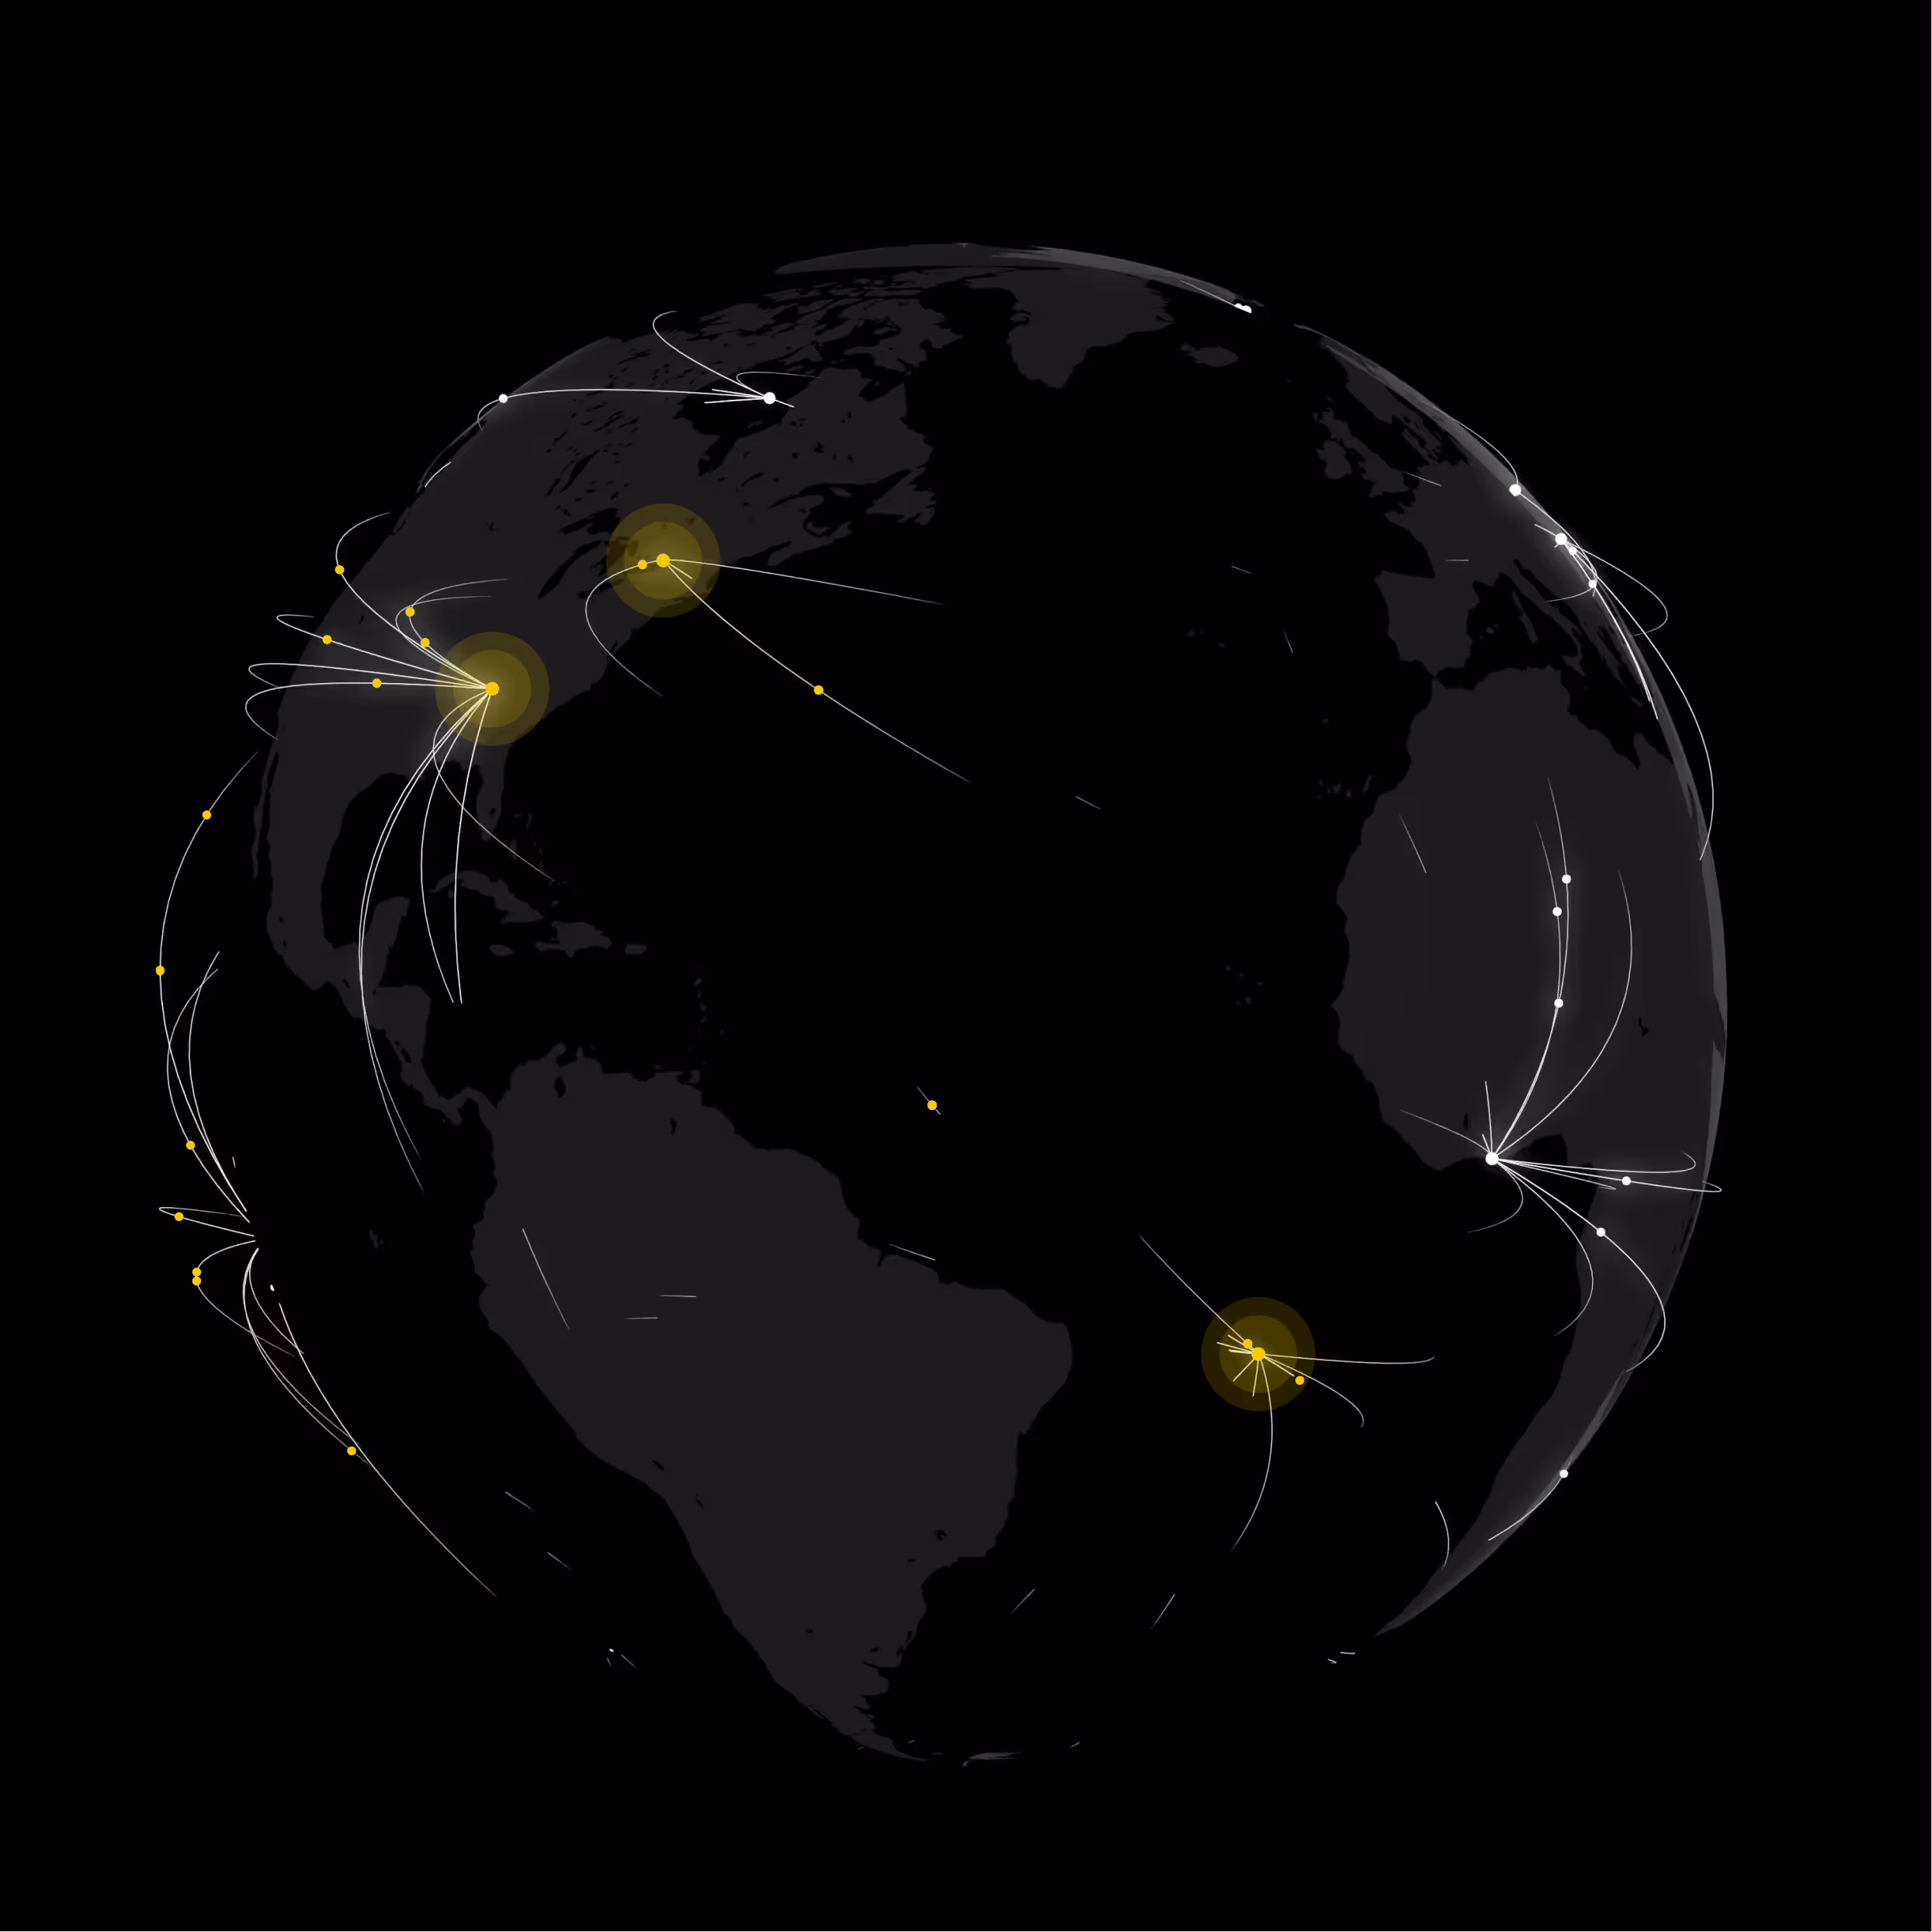


Mountain View, California carries a BaseScore of 35/100 (Tier 2: Low), with 12,582 total threat incidents recorded across the city in 2025. Security teams evaluating Mountain View for operations, travel, or site selection need street-level intelligence to assess risk across their specific operating locations.
Peaceful Protest in Mountain View, California — 2025 Overview
Mountain View's BaseScore of 35/100 (Tier 2: Low) reflects the surrounding area's overall criminal incident environment — not protest activity or demonstration risk. Protests in Mountain View are overwhelmingly peaceful and are not categorized as threat events within Base Operations data.
BaseScore and Threat Overview for Mountain View, California
Mountain View's BaseScore of 35/100 places the city in Tier 2: Low on the Base Operations risk scale. In 2025, the city recorded 12,582 total incidents across 3 primary categories: Property Crime (62.4%, 7,846 incidents), Regulatory Offenses (21.3%, 2,685 incidents), Violent Crime (16.3%, 2,051 incidents).
What is BaseScore?
BaseScore is a standardized 0–100 risk rating that enables security teams to compare threat levels across any global location using the same validated methodology. Normalized for population density, weighted by crime severity, and updated monthly from 25,000+ sources, BaseScore delivers the consistent, granular intelligence that replaces fragmented government statistics and expensive consulting assessments. Learn more about our methodology
How Security Teams Use BaseScore
- Get apples-to-apples comparison of risk across your entire location footprint — from Mumbai to Miami to Munich
- Prioritize the highest-risk sites and build a tiered approach to security resource allocation
- Turn hours of manual research into minutes of analysis with standardized, street-level threat intelligence
BaseScore Risk Tiers
| Tier | Score Range | Risk Label |
|---|---|---|
| 1 | 0–20 | Minimal |
| 2 | 21–40 | Low ← Mountain View |
| 3 | 41–60 | Moderate |
| 4 | 61–80 | High |
| 5 | 81–100 | Critical |
Recent Peaceful Protest News in Mountain View, California
Intelligence Disclaimer: The following news items are sourced via AI agent analysis of open sources. Confidence levels reflect source reliability — High: government or Base Operations verified data; Medium: multiple corroborating sources; Low: single source or extrapolated. AI agents can provide incorrect or misleading information. For verified, up-to-date threat analysis, use the Base Operations platform.
Protesters Rally in Mountain View Over Housing Crisis
Source: Mountain View Voice | Date: 2024-02-15 | Confidence: Medium
Security implication: Street-level threat data helps security teams assess localized risk patterns that city-level statistics miss — enabling data-driven decisions for personnel safety and asset protection.
Hundreds of residents gathered in downtown Mountain View to protest the ongoing housing crisis, demanding more affordable housing options. The demonstration highlighted the struggles of low-income families amidst rising rents and tech industry growth. Organizers called for immediate action from city officials to address zoning and development policies.
Mountain View Demonstration Calls for Climate Action
Source: The Mercury News | Date: 2024-03-22 | Confidence: Medium
Security implication: Street-level threat data helps security teams assess localized risk patterns that city-level statistics miss — enabling data-driven decisions for personnel safety and asset protection.
Environmental activists staged a protest in Mountain View, urging local government and tech companies to adopt stricter sustainability measures. The event, held near Google’s headquarters, drew attention to the city’s carbon footprint and lack of green initiatives. Protesters carried signs demanding renewable energy investments and reduced emissions.
Tech Workers Protest Layoffs in Mountain View
Source: San Francisco Chronicle | Date: 2024-01-10 | Confidence: Medium
Security implication: Street-level threat data helps security teams assess localized risk patterns that city-level statistics miss — enabling data-driven decisions for personnel safety and asset protection.
Dozens of tech employees protested outside a major tech campus in Mountain View following a wave of layoffs in the industry. The demonstrators expressed frustration over job insecurity and called for better labor protections. The event gained traction on social media, amplifying concerns about the tech sector’s volatility.
Mountain View Residents Protest Proposed Development Project
Source: Palo Alto Online | Date: 2024-05-18 | Confidence: Medium
Security implication: Street-level threat data helps security teams assess localized risk patterns that city-level statistics miss — enabling data-driven decisions for personnel safety and asset protection.
A group of Mountain View residents held a demonstration against a large-scale commercial development planned for their neighborhood. They argued that the project would increase traffic congestion and disrupt the community’s character. The protest aimed to pressure city council members to reconsider the proposal.
Education Advocates Protest School Funding Cuts in Mountain View
Source: ABC7 News | Date: 2024-04-03 | Confidence: Medium
Security implication: Street-level threat data helps security teams assess localized risk patterns that city-level statistics miss — enabling data-driven decisions for personnel safety and asset protection.
Parents and teachers rallied in Mountain View to oppose proposed budget cuts to local schools, citing potential impacts on student programs. The demonstration took place outside a school board meeting, with speakers urging officials to prioritize education funding. Attendees emphasized the need for community support to maintain quality education.
Peaceful Protest Category Breakdown in Mountain View, California
Mountain View recorded 12,582 total incidents across 3 primary threat categories in 2025.
| Category | 2025 Incidents | % of Total | Monthly Avg |
|---|---|---|---|
| Property Crime | 7,846 | 62.4% | 654 |
| Regulatory Offenses | 2,685 | 21.3% | 224 |
| Violent Crime | 2,051 | 16.3% | 171 |
| Total | 12,582 | 100% | 1,052 |
Data source: Base Operations platform, January–December 2025, Mountain View city-level.
Boundary maps show you how risk shifts block by block so your team spots vulnerabilities other assessments miss.

Drill down to individual incident coordinates for the context your team needs to make confident security recommendations.

See where specific threat types cluster, giving your analysts a clear starting point for any site assessment.


Trusted by proactive security leaders
Base Operations improved our executive security posture by enabling us to proactively identify threats and adjust security measures in both existing, remodeled, or newly acquired residential properties for senior executives. Nearby residential high net worth burglaries and break ins could have been a wake-up call too late. Instead, it became an opportunity to demonstrate the value of data-driven security planning.


Street level intelligence for EP teams is an absolute game-changer. If you're not aware of what this is, the implications, and how this benefits large full scope enterprise teams as well as individual operators, you're behind the curve. I highly recommend folks in the EP space check out Base Operations. Over the last 5+ years, the level of data collected, ingested and analyzed is nothing short of extremely impressive.

Base Operations informs our strategic and routine security planning across the world. The unmatched granularity of micro-intelligence supports our supply chain security planning and dramatically improves our travel security guidance.

Quickly became our key risk evaluation tool for event, travel, and office security. New use cases developed weekly from real estate to leadership insights. Great platform!

In the past 5 days I haven’t closed Base Operations. I give It a 10 out of 10.