

Boston, Massachusetts carries a BaseScore of 53/100 (Tier 3: Moderate), with 36,665 total threat incidents recorded across the city in 2025. Security teams evaluating Boston for operations, travel, or site selection need street-level intelligence to assess risk across their specific operating locations.
Unrest in Boston, Massachusetts — 2025 Overview
Boston recorded 36,665 total incidents in 2025, averaging 3,055 per month. The city's BaseScore of 53/100 (Tier 3: Moderate) reflects the local threat environment. Property Crime accounts for the largest share at 57.9% (21,236 incidents), but threat levels vary at the sub-mile level.
BaseScore and Threat Overview for Boston, Massachusetts
Boston's BaseScore of 53/100 places the city in Tier 3: Moderate on the Base Operations risk scale. In 2025, the city recorded 36,665 total incidents across 3 primary categories: Property Crime (57.9%, 21,236 incidents), Violent Crime (23.4%, 8,597 incidents), Regulatory Offenses (18.6%, 6,832 incidents).
What is BaseScore?
BaseScore is a standardized 0–100 risk rating that enables security teams to compare threat levels across any global location using the same validated methodology. Normalized for population density, weighted by crime severity, and updated monthly from 25,000+ sources, BaseScore delivers the consistent, granular intelligence that replaces fragmented government statistics and expensive consulting assessments. Learn more about our methodology
How Security Teams Use BaseScore
- Get apples-to-apples comparison of risk across your entire location footprint — from Mumbai to Miami to Munich
- Prioritize the highest-risk sites and build a tiered approach to security resource allocation
- Turn hours of manual research into minutes of analysis with standardized, street-level threat intelligence
BaseScore Risk Tiers
| Tier | Score Range | Risk Label |
|---|---|---|
| 1 | 0–20 | Minimal |
| 2 | 21–40 | Low |
| 3 | 41–60 | Moderate ← Boston |
| 4 | 61–80 | High |
| 5 | 81–100 | Critical |
Recent Unrest News in Boston, Massachusetts
Intelligence Disclaimer: The following news items are sourced via AI agent analysis of open sources. Confidence levels reflect source reliability — High: government or Base Operations verified data; Medium: multiple corroborating sources; Low: single source or extrapolated. AI agents can provide incorrect or misleading information. For verified, up-to-date threat analysis, use the Base Operations platform.
Boston Police Respond to Downtown Protest Over Housing Crisis
Source: The Boston Globe | Date: 2024-02-15 | Confidence: Medium
Security implication: Street-level threat data helps security teams assess localized risk patterns that city-level statistics miss — enabling data-driven decisions for personnel safety and asset protection.
A large protest in downtown Boston over the ongoing housing crisis led to temporary road closures and heightened police presence. Demonstrators called for affordable housing reforms, citing skyrocketing rents and evictions. Minor clashes were reported, but no arrests were made.
Unrest in South Boston Following Community Center Funding Cuts
Source: Boston Herald | Date: 2024-03-22 | Confidence: Medium
Security implication: Street-level threat data helps security teams assess localized risk patterns that city-level statistics miss — enabling data-driven decisions for personnel safety and asset protection.
Residents of South Boston staged a demonstration after city officials announced funding cuts to local community centers. The protest escalated briefly with some property damage reported near the affected facilities. Police intervened to disperse the crowd, and two individuals were detained.
Boston University Students Clash with Police During Campus Protest
Source: WBUR News | Date: 2024-04-10 | Confidence: Medium
Security implication: Street-level threat data helps security teams assess localized risk patterns that city-level statistics miss — enabling data-driven decisions for personnel safety and asset protection.
A protest at Boston University over tuition hikes turned tense as students clashed with campus and city police. Several students were arrested after refusing to disperse, and videos of the incident have circulated widely on social media. The university issued a statement urging calm and dialogue.
Roxbury Rally Turns Violent, Several Injured in Confrontation
Source: NBC Boston | Date: 2024-06-18 | Confidence: Medium
Security implication: Street-level threat data helps security teams assess localized risk patterns that city-level statistics miss — enabling data-driven decisions for personnel safety and asset protection.
A rally in Roxbury advocating for police reform escalated into violence, with several participants and officers injured. The confrontation began after counter-protesters arrived, leading to physical altercations. Authorities are investigating the incident and have promised a full report.
Boston Common Protest Over Climate Policies Draws Thousands
Source: CBS Boston | Date: 2024-09-05 | Confidence: Medium
Security implication: Street-level threat data helps security teams assess localized risk patterns that city-level statistics miss — enabling data-driven decisions for personnel safety and asset protection.
Thousands gathered at Boston Common to protest insufficient climate policies, leading to minor unrest as some groups blocked traffic. Police monitored the situation closely, with a few arrests made for disorderly conduct. Organizers vowed to continue their efforts until significant policy changes are enacted.
Unrest Category Breakdown in Boston, Massachusetts
Boston recorded 36,665 total incidents across 3 primary threat categories in 2025.
| Category | 2025 Incidents | % of Total | Monthly Avg |
|---|---|---|---|
| Property Crime | 21,236 | 57.9% | 1,770 |
| Violent Crime | 8,597 | 23.4% | 716 |
| Regulatory Offenses | 6,832 | 18.6% | 569 |
| Total | 36,665 | 100% | 3,055 |
Data source: Base Operations platform, January–December 2025, Boston city-level.
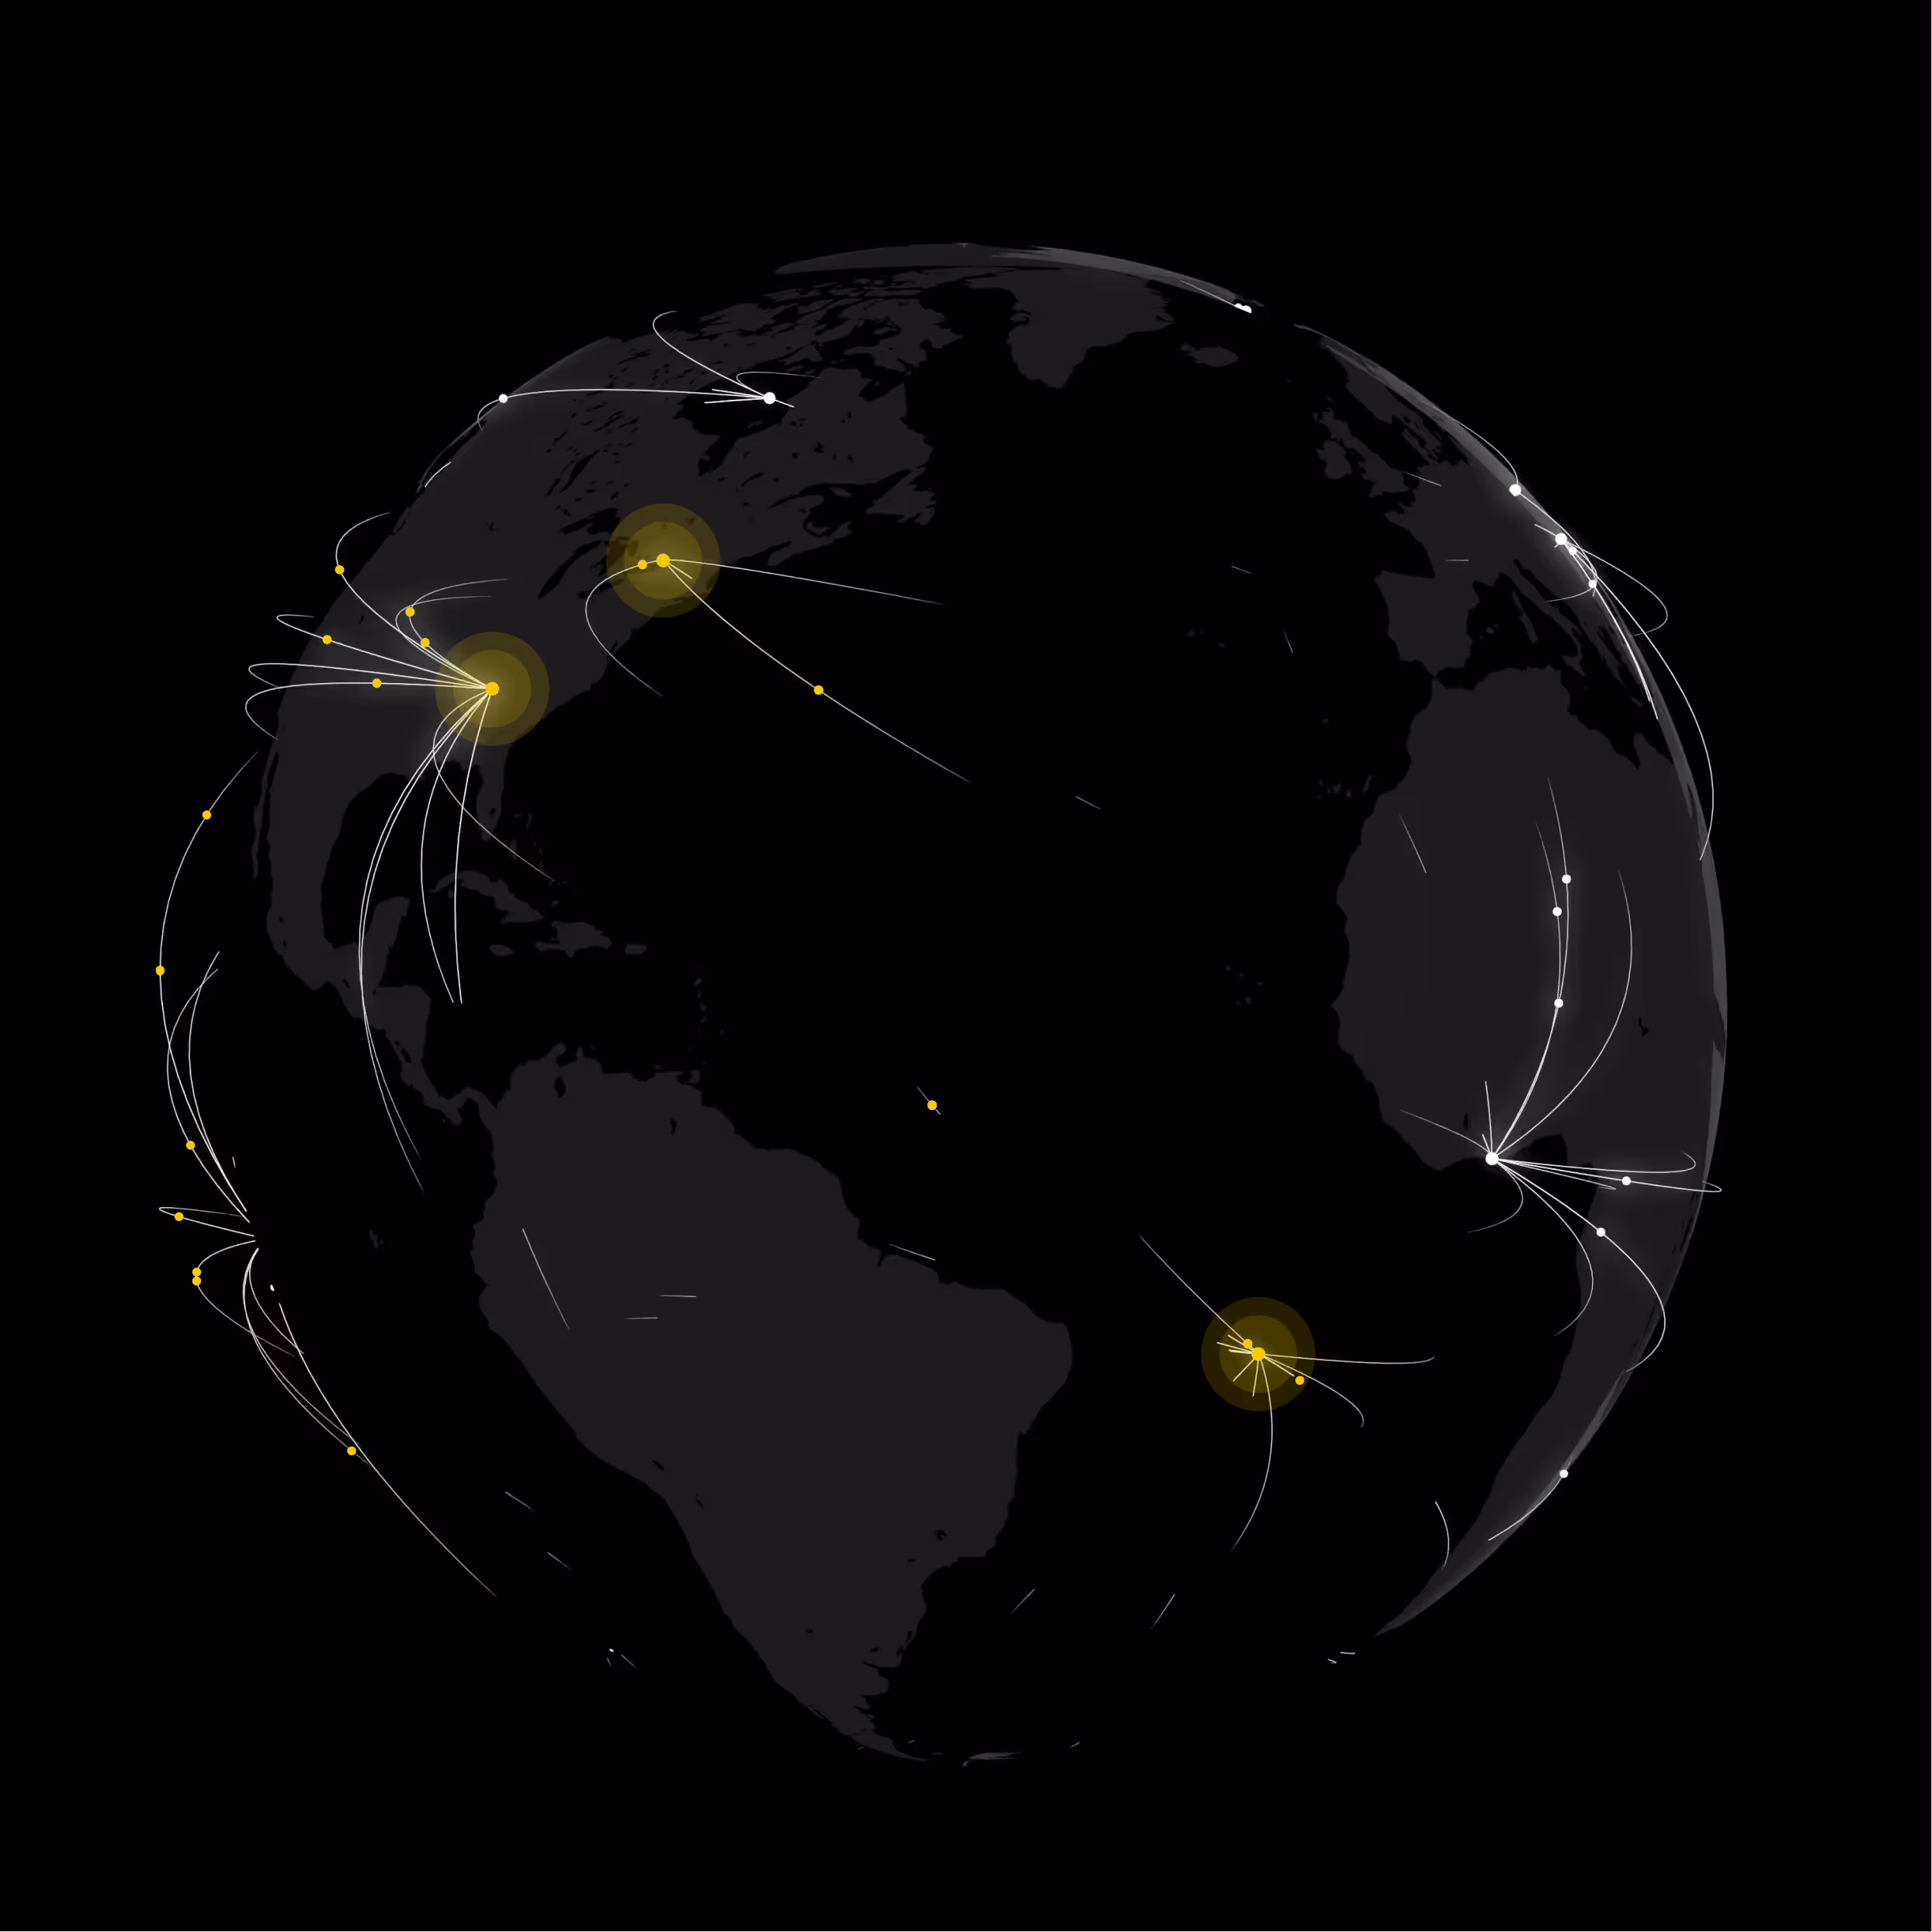
Boundary maps show you how risk shifts block by block so your team spots vulnerabilities other assessments miss.

Drill down to individual incident coordinates for the context your team needs to make confident security recommendations.

See where specific threat types cluster, giving your analysts a clear starting point for any site assessment.


Trusted by proactive security leaders
Base Operations improved our executive security posture by enabling us to proactively identify threats and adjust security measures in both existing, remodeled, or newly acquired residential properties for senior executives. Nearby residential high net worth burglaries and break ins could have been a wake-up call too late. Instead, it became an opportunity to demonstrate the value of data-driven security planning.


Street level intelligence for EP teams is an absolute game-changer. If you're not aware of what this is, the implications, and how this benefits large full scope enterprise teams as well as individual operators, you're behind the curve. I highly recommend folks in the EP space check out Base Operations. Over the last 5+ years, the level of data collected, ingested and analyzed is nothing short of extremely impressive.

Base Operations informs our strategic and routine security planning across the world. The unmatched granularity of micro-intelligence supports our supply chain security planning and dramatically improves our travel security guidance.

Quickly became our key risk evaluation tool for event, travel, and office security. New use cases developed weekly from real estate to leadership insights. Great platform!

In the past 5 days I haven’t closed Base Operations. I give It a 10 out of 10.