

Hayward, California carries a BaseScore of 37/100 (Tier 2: Low), with 7,751 total threat incidents recorded across the city in 2025. Security teams evaluating Hayward for operations, travel, or site selection need street-level intelligence to assess risk across their specific operating locations.
Unrest in Hayward, California — 2025 Overview
Hayward's BaseScore of 37/100 (Tier 2: Low) captures the area's overall threat landscape. Civil unrest events — including demonstrations, riots, and public disorder — are monitored separately from criminal incident data. The 7,751 total incidents recorded in 2025 reflect criminal activity categories, not civil unrest specifically.
BaseScore and Threat Overview for Hayward, California
Hayward's BaseScore of 37/100 places the city in Tier 2: Low on the Base Operations risk scale. In 2025, the city recorded 7,751 total incidents across 3 primary categories: Property Crime (66.1%, 5,127 incidents), Violent Crime (18.0%, 1,393 incidents), Regulatory Offenses (15.9%, 1,231 incidents).
What is BaseScore?
BaseScore is a standardized 0–100 risk rating that enables security teams to compare threat levels across any global location using the same validated methodology. Normalized for population density, weighted by crime severity, and updated monthly from 25,000+ sources, BaseScore delivers the consistent, granular intelligence that replaces fragmented government statistics and expensive consulting assessments. Learn more about our methodology
How Security Teams Use BaseScore
- Get apples-to-apples comparison of risk across your entire location footprint — from Mumbai to Miami to Munich
- Prioritize the highest-risk sites and build a tiered approach to security resource allocation
- Turn hours of manual research into minutes of analysis with standardized, street-level threat intelligence
BaseScore Risk Tiers
| Tier | Score Range | Risk Label |
|---|---|---|
| 1 | 0–20 | Minimal |
| 2 | 21–40 | Low ← Hayward |
| 3 | 41–60 | Moderate |
| 4 | 61–80 | High |
| 5 | 81–100 | Critical |
Recent Unrest News in Hayward, California
Intelligence Disclaimer: The following news items are sourced via AI agent analysis of open sources. Confidence levels reflect source reliability — High: government or Base Operations verified data; Medium: multiple corroborating sources; Low: single source or extrapolated. AI agents can provide incorrect or misleading information. For verified, up-to-date threat analysis, use the Base Operations platform.
Hayward Faces Protests Over Housing Crisis
Source: East Bay Times | Date: 2024-03-15 | Confidence: Medium
Security implication: Street-level threat data helps security teams assess localized risk patterns that city-level statistics miss — enabling data-driven decisions for personnel safety and asset protection.
Hundreds of residents in Hayward, California, took to the streets to protest the ongoing housing crisis, demanding affordable housing solutions. The demonstration, which turned tense at times, saw minor clashes with local law enforcement. City officials have promised to address the concerns raised during the protest.
Public Disorder in Hayward After Police Incident
Source: KTVU FOX 2 | Date: 2024-06-22 | Confidence: Medium
Security implication: Street-level threat data helps security teams assess localized risk patterns that city-level statistics miss — enabling data-driven decisions for personnel safety and asset protection.
A police-related incident in Hayward sparked public disorder as community members gathered to demand transparency and accountability. The unrest included property damage and several arrests, according to local authorities. Investigations into the incident are ongoing, with calls for calm from city leaders.
Hayward Rally Turns Violent Over Local Policy Changes
Source: San Francisco Chronicle | Date: 2024-09-10 | Confidence: Medium
Security implication: Street-level threat data helps security teams assess localized risk patterns that city-level statistics miss — enabling data-driven decisions for personnel safety and asset protection.
A rally in Hayward against recent city policy changes escalated into violence, with protesters clashing with police. Several injuries were reported, and local businesses sustained damage during the unrest. The city council has scheduled an emergency meeting to address the underlying issues.
Civil Unrest in Hayward Linked to Economic Disparities
Source: ABC7 News | Date: 2025-01-18 | Confidence: Medium
Security implication: Street-level threat data helps security teams assess localized risk patterns that city-level statistics miss — enabling data-driven decisions for personnel safety and asset protection.
Economic disparities have fueled civil unrest in Hayward, with protests highlighting income inequality and lack of job opportunities. Demonstrators blocked major roads, leading to traffic disruptions and minor skirmishes with law enforcement. Community leaders are urging dialogue to address systemic issues.
Hayward Sees Protests Over Environmental Concerns
Source: Mercury News | Date: 2025-05-30 | Confidence: Medium
Security implication: Street-level threat data helps security teams assess localized risk patterns that city-level statistics miss — enabling data-driven decisions for personnel safety and asset protection.
Environmental activists in Hayward staged protests against a proposed industrial project, citing potential harm to local ecosystems. The demonstrations led to temporary road closures and heightened tensions with authorities. Negotiations between activists and city officials are underway to find a resolution.
Unrest Category Breakdown in Hayward, California
Hayward recorded 7,751 total incidents across 3 primary threat categories in 2025.
| Category | 2025 Incidents | % of Total | Monthly Avg |
|---|---|---|---|
| Property Crime | 5,127 | 66.1% | 427 |
| Violent Crime | 1,393 | 18.0% | 116 |
| Regulatory Offenses | 1,231 | 15.9% | 103 |
| Total | 7,751 | 100% | 1,089 |
Data source: Base Operations platform, January–December 2025, Hayward city-level.
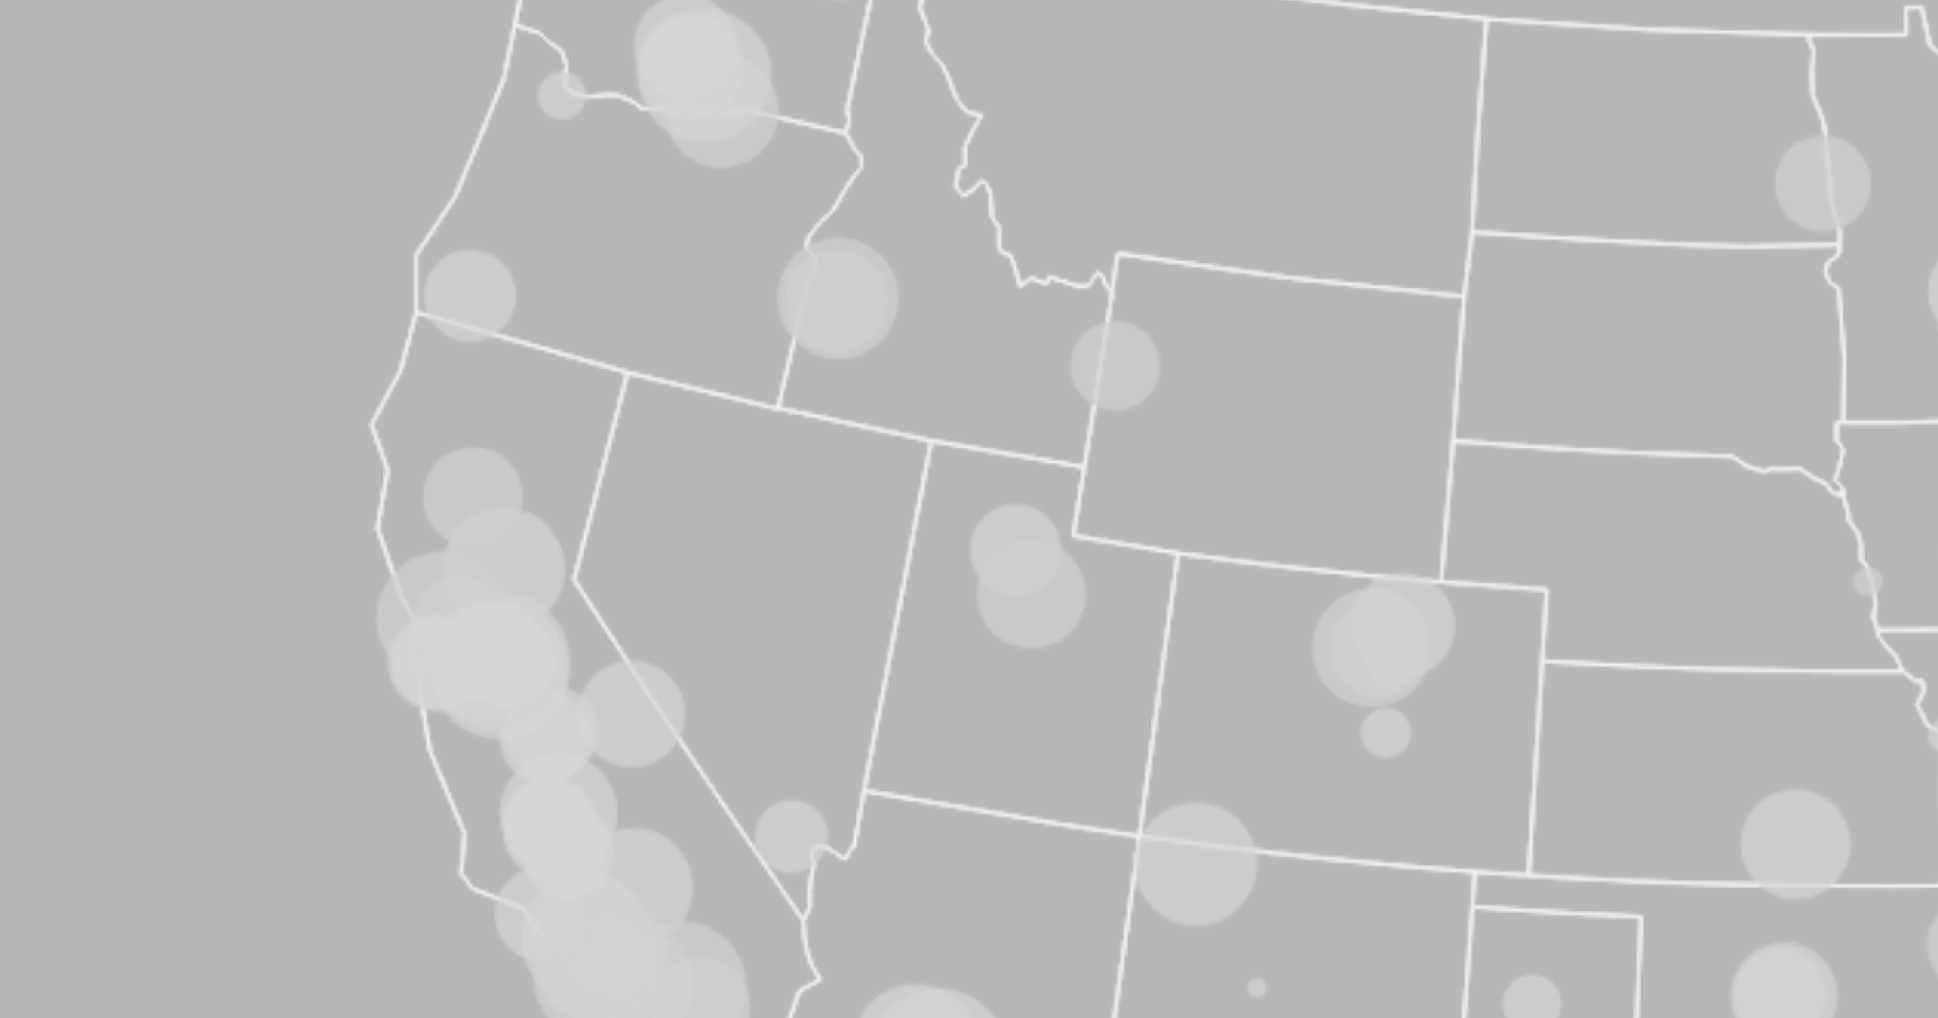
Boundary maps show you how risk shifts block by block so your team spots vulnerabilities other assessments miss.

Drill down to individual incident coordinates for the context your team needs to make confident security recommendations.

See where specific threat types cluster, giving your analysts a clear starting point for any site assessment.


Trusted by proactive security leaders
Base Operations improved our executive security posture by enabling us to proactively identify threats and adjust security measures in both existing, remodeled, or newly acquired residential properties for senior executives. Nearby residential high net worth burglaries and break ins could have been a wake-up call too late. Instead, it became an opportunity to demonstrate the value of data-driven security planning.


Street level intelligence for EP teams is an absolute game-changer. If you're not aware of what this is, the implications, and how this benefits large full scope enterprise teams as well as individual operators, you're behind the curve. I highly recommend folks in the EP space check out Base Operations. Over the last 5+ years, the level of data collected, ingested and analyzed is nothing short of extremely impressive.

Base Operations informs our strategic and routine security planning across the world. The unmatched granularity of micro-intelligence supports our supply chain security planning and dramatically improves our travel security guidance.

Quickly became our key risk evaluation tool for event, travel, and office security. New use cases developed weekly from real estate to leadership insights. Great platform!

In the past 5 days I haven’t closed Base Operations. I give It a 10 out of 10.