Crime Data API for Enterprise Security: A Complete Integration and Vendor Guide
Enterprise crime data API guide comparing 5 API categories, vendor capabilities, latency benchmarks, and integration specs for GSOC, facility risk, and site selection use cases.

What Is a Crime Data API for Enterprise Security?
A crime data API for enterprise security is a software interface that delivers structured crime incident data or risk scores to a company's internal systems on demand, typically over REST/JSON, so security teams can assess location risk without manually collecting reports from dozens of separate police departments. It replaces the patchwork process of pulling data from individual city and county sources one at a time. Enterprises with distributed footprints, including retail chains, financial institutions, and global consultancies, use these APIs to standardize threat intelligence across every location, region, and country they operate in.
Crime data API: A software interface that delivers structured crime incident data or calculated risk scores in a machine-readable format, usually JSON, for integration into internal security or business systems.
GSOC: A Global Security Operations Center: the centralized team that monitors, analyzes, and responds to security threats across an organization's worldwide footprint.
Direct answer: A crime data API for enterprise security is a REST/JSON interface delivering normalized crime data and risk scores from thousands of jurisdictions in one feed, replacing manual, city-by-city collection with a single standardized source teams can query on demand.
A security analyst at a global energy infrastructure company described the problem this type of API solves: the alternative to a unified feed is going to separate sources, "NYPD crime data, Toronto police crime data," and manually reconciling them, a process that consumes hours a single API call eliminates. Raw government data compounds the problem. Analysts at a global entertainment and media company found that police records skip reporting months, arrive in batches, and shift crime categorization for political or policy reasons, making unvalidated government feeds unreliable as a standalone input for enterprise risk decisions. Enterprise-grade providers in this category, including Base Operations, layer normalization, geocoding, and risk scoring on top of raw incident feeds to close that gap.
Five Enterprise Use Cases for Crime Data APIs
Security Operations Center (SOC) Situational Awareness
Security operations centers use a crime incident feed (a continuous stream of structured records describing individual crime events, including type, location, and date) to build a common operating picture across a company's facility portfolio. Base Operations updates crime risk scoring monthly rather than pushing alerts, so GSOC teams use it as the persistent threat landscape layer that sits alongside event-driven platforms such as Dataminr and Everbridge, which handle real-time notification separately. At a global consultancy with 280,000 employees and more than 75 offices, giving GSOC field analysts direct platform access increased platform usage substantially, since analysts could provide more accurate situational awareness for event safety and executive protection. A Fortune 10 company with 1.5 million employees and 500+ locations replaced scattered monitoring tools with one unified view of crime and unrest across its full footprint, compressing assessment time from weeks to hours.
Facility Risk Assessment and Portfolio Scoring
Crime risk score: A standardized number, for example 0-100, that quantifies the relative threat level of a specific location based on multiple crime categories and data sources.
Batch scoring: The ability to submit multiple locations, such as an entire real estate portfolio, in a single API call and receive risk scores for each address in return.
Security leaders use crime risk scores and batch scoring to benchmark every location in a portfolio, prioritize security budget toward the highest-risk sites, and support internal or regulatory audits. A discount retailer with more than 16,000 locations analyzed crime patterns within a 0.1-mile radius of its highest-risk stores, breaking incidents down by time of day and day of week; within six months, security incidents fell 75%. A global consultancy used the same approach to rank locations by threat level, cutting the time required by 35% and adding automated month-over-month change detection to flag locations where risk was rising.
Site Selection and Expansion Strategy
Real estate, strategy, and security teams combine crime risk data with location intelligence to evaluate potential sites before signing a lease or completing a purchase. A financial institution managing $5 trillion in assets under management, with 247 offices, integrated the API directly into its internal risk models: site assessments that once took a full week per location became five neighborhoods evaluated in that same week, a 5x acceleration, and real estate team requests for risk data increased 300% in the first month. A Fortune 10 company used the same approach to assess more than 500 office locations across 35 metropolitan markets under an accelerated executive timeline.
Employee and Traveller Safety Programs
Travel security and HR teams use crime data APIs to support duty-of-care programs, evaluating destination safety, hotel neighborhoods, and commute routes before employees travel or relocate. Base Operations provides pre-trip and on-demand location risk scoring that informs these policies; teams needing real-time, event-driven travel alerts pair it with a platform such as Dataminr Pulse or Everbridge NC4, which handle that layer separately. A Fortune 10 company used alternative route analysis to identify safer commuter options with minimal added travel time, and used points-of-interest mapping to study transit-stop proximity across its office locations. In corporate travel programs, teams run destination safety assessments and hotel-area risk scoring to replace generic travel warnings with evidence-based booking policies.
Insurance Underwriting and Compliance Reporting
Risk, compliance, and insurance teams use crime scoring APIs to support policy development, regulatory reporting, and loss-prevention benchmarking. A security risk manager at a global recruitment technology company noted that predictive models need five or more years of historical data before they become statistically reliable, while teams still face pressure to demonstrate ROI long before that data matures, a gap that externally sourced, commercially normalized crime scoring can close. A financial institution used standardized BaseScore™ data to compare risk across neighborhoods, track how crime patterns evolved in target investment areas over time, and break down crime types relevant to specific property uses in its underwriting models.
Use Case to Capability Map
The Five Categories of Crime Data APIs: And What Each One Delivers
Enterprise buyers evaluating crime data APIs are choosing from five distinct categories of providers, each built for different latency, coverage, and use-case requirements. Understanding which category a vendor falls into, more than any single feature comparison, determines whether it fits GSOC workflows, site selection, or underwriting.
Category 1: Public Law Enforcement Feeds (Free, Historical)
The FBI Crime Data Explorer API and the UK Police Data API sit at the entry point of the market: free, government-run interfaces that aggregate offense counts and block-level incidents reported by participating agencies, refreshed monthly to quarterly. They suit baseline analytics and historical benchmarking but were not built for enterprise operations. A National Guard officer planning security for a major international event described colleagues resorting to searching "most dangerous cities" on Google for mission-critical decisions, a workaround that reflects both the appeal and the limits of free government data at scale.
Category 2: Commercial Incident Aggregators (Near Real-Time)
Aggregators such as SpotCrime and LexisNexis CityProtect normalize police blotter, computer-aided dispatch, and records management system data from thousands of individual agencies into one consistent feed, typically refreshed every 4 to 24 hours. This category addresses a real problem: analysts at a global entertainment and media company found that raw police data is inconsistent across jurisdictions, agencies skip reporting months, batch-submit records, and change crime categorization for political or policy reasons. Aggregators reduce that noise, but enterprise buyers should confirm each vendor's legal provenance and sourcing agreements before relying on the feed for compliance-sensitive decisions.
Category 3: Sensor-Based High-Velocity Alert Feeds
Acoustic sensor networks such as ShotSpotter form a distinct category built around machine-classified physical detections rather than reported incidents. Deployed across more than 125 U.S. cities, these systems can flag gunfire in under 60 seconds, making them relevant for enterprises protecting high-risk facilities or mobile field workforces within instrumented zones. Coverage is narrow and hardware-dependent by design, limited to deployed areas rather than full metropolitan or global footprints, so this category complements rather than replaces broader crime risk intelligence.
Category 4: Crime Risk Scoring and Analytical Indices
Normalized risk index providers, including Precisely CrimeRisk, CAP Index CRIMECAST, and Base Operations, convert raw incident counts into a single comparable score per location instead of reporting individual events. These platforms support batch scoring across a portfolio and typically resolve to the address level, making them the category best suited to underwriting, site selection, and portfolio-wide benchmarking. A financial institution's business intelligence team used this type of API integration to build a standardized scoring mechanism it could apply consistently across every property in its portfolio.
Category 5: Global Threat Intelligence Platforms with Crime Layers
Platforms such as Dataminr Pulse and Everbridge NC4 bundle violent crime alongside natural hazards, civil unrest, and other events into a single multi-hazard intelligence feed, drawing on AI-parsed social and sensor sources with human-vetted validation across more than 190 countries. They are built for event-driven alerting and integrate into corporate emergency management stacks. This category answers a different question than persistent risk scoring: it tells a security team when something has happened, not which locations carry elevated baseline risk month over month.
The table below summarizes all five categories side by side, using the same six criteria enterprise procurement teams apply during vendor evaluation.
Comparison Table: Crime Data API Categories at a Glance
Key Technical Specifications to Evaluate in an Enterprise Crime Data API
Beyond category, several technical variables determine whether a vendor fits an enterprise integration.
Data Latency: Matching Refresh Rate to Response Playbooks
Latency (data freshness): The time gap between when a crime event occurs and when it appears in the API's data feed, ranging from seconds to months depending on the source.
Latency needs vary by use case. Gunshot detection systems operate in seconds; social and sensor fusion platforms operate in minutes; police records management systems refresh in hours; federal indexed data refreshes monthly. Enterprise teams should match the latency tier to the response playbook it feeds. Base Operations updates BaseScore monthly by design: a single high-profile event should not distort a location's underlying risk picture in a way that misrepresents its standard threat level, so month-over-month change detection is the tool for spotting a genuine shift.
Geographic Coverage: Agency Count, Country List, and Density Maps
Coverage claims vary widely in what they actually mean. Some vendors count verified law enforcement agencies under formal data-sharing agreements; others count scraped public sources of uneven reliability. Buyers should ask whether coverage is US-only or global, whether it includes density maps showing gaps, and whether the vendor will publish its agency or source list. Source lists matter for legal defensibility: security teams need to show exactly where a risk score came from, not treat it as an unverifiable black box, particularly when the assessment supports a budget, staffing, or underwriting decision.
API Architecture: REST, Webhooks, Batch Processing, and GeoJSON Support
GeoJSON: An open data format for encoding geographic features such as points, lines, and boundaries, widely used to display location data on maps and in GIS software.
Enterprise integrations typically need REST/JSON for on-demand queries, webhook or push support for event-driven workflows, batch endpoints for portfolio-wide scoring, and GeoJSON output for compatibility with GIS platforms such as Esri ArcGIS. A financial institution's business intelligence team used exactly this pattern, pulling crime data and change-detection metrics through a REST API directly into its internal risk models rather than exporting and re-importing static files.
Enterprise SLA, Uptime, and Security Compliance
Enterprise procurement teams should confirm four things before signing: a published uptime SLA percentage, SOC 2 Type II compliance, data handling that satisfies GDPR and CCPA requirements, and a defined support tier with a named point of contact rather than a ticket queue. Most competitor product pages leave these details out, which makes them worth asking about directly during a vendor evaluation. Base Operations is SOC 2 Type II compliant and hosted on AWS infrastructure, with single sign-on and multi-factor authentication available across all pricing tiers.
Data Methodology: How Crime Risk Scores Are Calculated
Raw incident counts and modeled risk indices answer different questions: a count shows what happened, while an index estimates the probability of future risk based on dozens of weighted variables, such as CAP Index's CRIMECAST model, which draws on more than 70 variables. A security analyst at a global energy infrastructure company put the underlying concern directly: stakeholders will not trust a "black box" score without seeing the source material and methodology behind it. Enterprise buyers should require vendors to disclose variable counts and confirm that scoring models exclude race, religion, and national origin as inputs.
Which API Category Fits Your Use Case?
Is There a Free Crime Data API?
Yes, free crime data APIs exist, but they come with real limitations for enterprise use. The FBI Crime Data Explorer, the UK Police Data API, and various open municipal data portals all provide no-cost access to crime records. The trade-offs are consistent across each: no service-level agreement, reporting gaps between agencies, no real-time updates, and no cross-jurisdiction normalization, so the same crime type may be labeled differently from one city to the next. A National Guard officer planning event security described colleagues defaulting to searching "most dangerous cities" using free public sources for mission-critical planning decisions, even inside a well-resourced organization, a reminder of how far reach exceeds reliability with free data at enterprise scale. Free sources work well as a starting point or a supplementary cross-check, not as the sole input for decisions involving facility investment, executive safety, or compliance reporting.
The FBI Crime Data API: What It Is and What It Isn't
The FBI Crime Data Explorer API (CDE) provides free programmatic access to Uniform Crime Reporting (UCR) and National Incident-Based Reporting System (NIBRS) data submitted voluntarily by participating law enforcement agencies across the United States. Data is reported at the agency level, not the address level, and refreshes on a monthly cadence tied to FBI publication schedules. Access requires a free API key issued through the FBI's developer portal, and endpoints return JSON structured around agency, offense type, and reporting period.
What the FBI CDE cannot do matters more for enterprise planning than what it can. It does not support real-time alerting. It cannot resolve to a specific address or geographic radius, since data is reported per agency jurisdiction, which can span an entire city or county. It does not produce a calculated risk score, only raw offense counts. Because agency participation is voluntary, coverage gaps exist: some jurisdictions report inconsistently or not at all, which limits its use as a standalone data source for a distributed enterprise footprint.
SpotCrime API: Capabilities, Coverage, and Enterprise Fit
SpotCrime aggregates more than 500 million crime records across more than 22,000 cities, refreshing its data roughly every 15 minutes and reporting 99.9% uptime. Each incident carries a SpotScore, a relative safety rating tied to the surrounding area. For enterprise buyers, SpotCrime's core strength is breadth combined with developer-friendly integration: the API is straightforward to implement and covers a wide swath of the US market without a lengthy onboarding process. The trade-offs enterprise teams should weigh are variable geographic accuracy, since incident locations are sourced from law enforcement postings that are not independently verified for precision, and a support model built for individual developers rather than enterprise account management, SLAs, or compliance documentation. Organizations evaluating SpotCrime for enterprise deployment should confirm data provenance for their specific coverage area before relying on it for underwriting or compliance-sensitive decisions.
CrimeOMeter API: Features, Output Format, and Use Cases
CrimeOMeter offers three related products: a Crime Data API that returns raw incident-level records, a Crime Stats API that returns aggregated statistics including a Crime Severity Index (CSI) and Safety Index for a given area, and a Crime Map API for visualizing incidents geographically. Responses are structured as JSON objects containing incident type, location coordinates, and timestamp, or, for the stats endpoints, a composite score summarizing relative safety. CrimeOMeter fits applications that need a single lightweight endpoint for consumer-facing safety scores, such as real estate or rental platforms displaying a neighborhood safety indicator. For enterprise security programs managing a large facility portfolio, the more relevant limitations are the absence of enterprise-grade SLAs, limited methodology transparency behind the composite index scores, and coverage that skews toward major metropolitan areas rather than the full geographic spread many global enterprises need.
How to Get Crime Data by ZIP Code via API
ZIP codes are a common but flawed unit for crime risk analysis because they were designed for mail delivery, not for describing neighborhood boundaries, and a single ZIP code can span both low-risk and high-risk blocks within the same postal area. Some APIs, including CrimeOMeter and various municipal portals, support ZIP-code-level queries directly. For enterprise use, address-level or radius-based analysis is the better standard: a discount retailer with more than 16,000 locations found that analyzing crime within a 0.1-mile radius of each store surfaced patterns completely invisible at ZIP-code aggregation. A financial institution used the same radius-based approach to distinguish risk levels between different areas of the same city, a level of granularity ZIP-code queries cannot provide. Enterprises evaluating a crime data API should prioritize vendors that support address-level or census-block-level geocoding over ZIP-code-only providers, including platforms like Base Operations and CAP Index.
Police Data API Options for Enterprise Security Teams
Enterprise teams choosing among police data APIs face a direct trade-off between two approaches. Direct government APIs, such as the UK Police Data API and the FBI Crime Data Explorer, offer clear legal provenance and unmodified source accuracy, but each agency reports on its own schema and schedule, making cross-jurisdiction comparison difficult. Aggregators, such as LexisNexis Community Crime Map and SpotCrime, normalize that data into one consistent format and typically publish uptime SLAs, at the cost of adding an intermediary layer between the enterprise and the original source. Security teams have felt both sides of this trade-off directly: analysts at a global entertainment and media company found that raw police feeds skip reporting months, batch-submit records, and shift crime categorization for political reasons, while a security analyst at a global energy infrastructure company described the alternative, reconciling NYPD data against Toronto police data by hand, as a process only cross-jurisdiction normalization could fix.
How Base Operations Delivers Crime Risk Intelligence via API
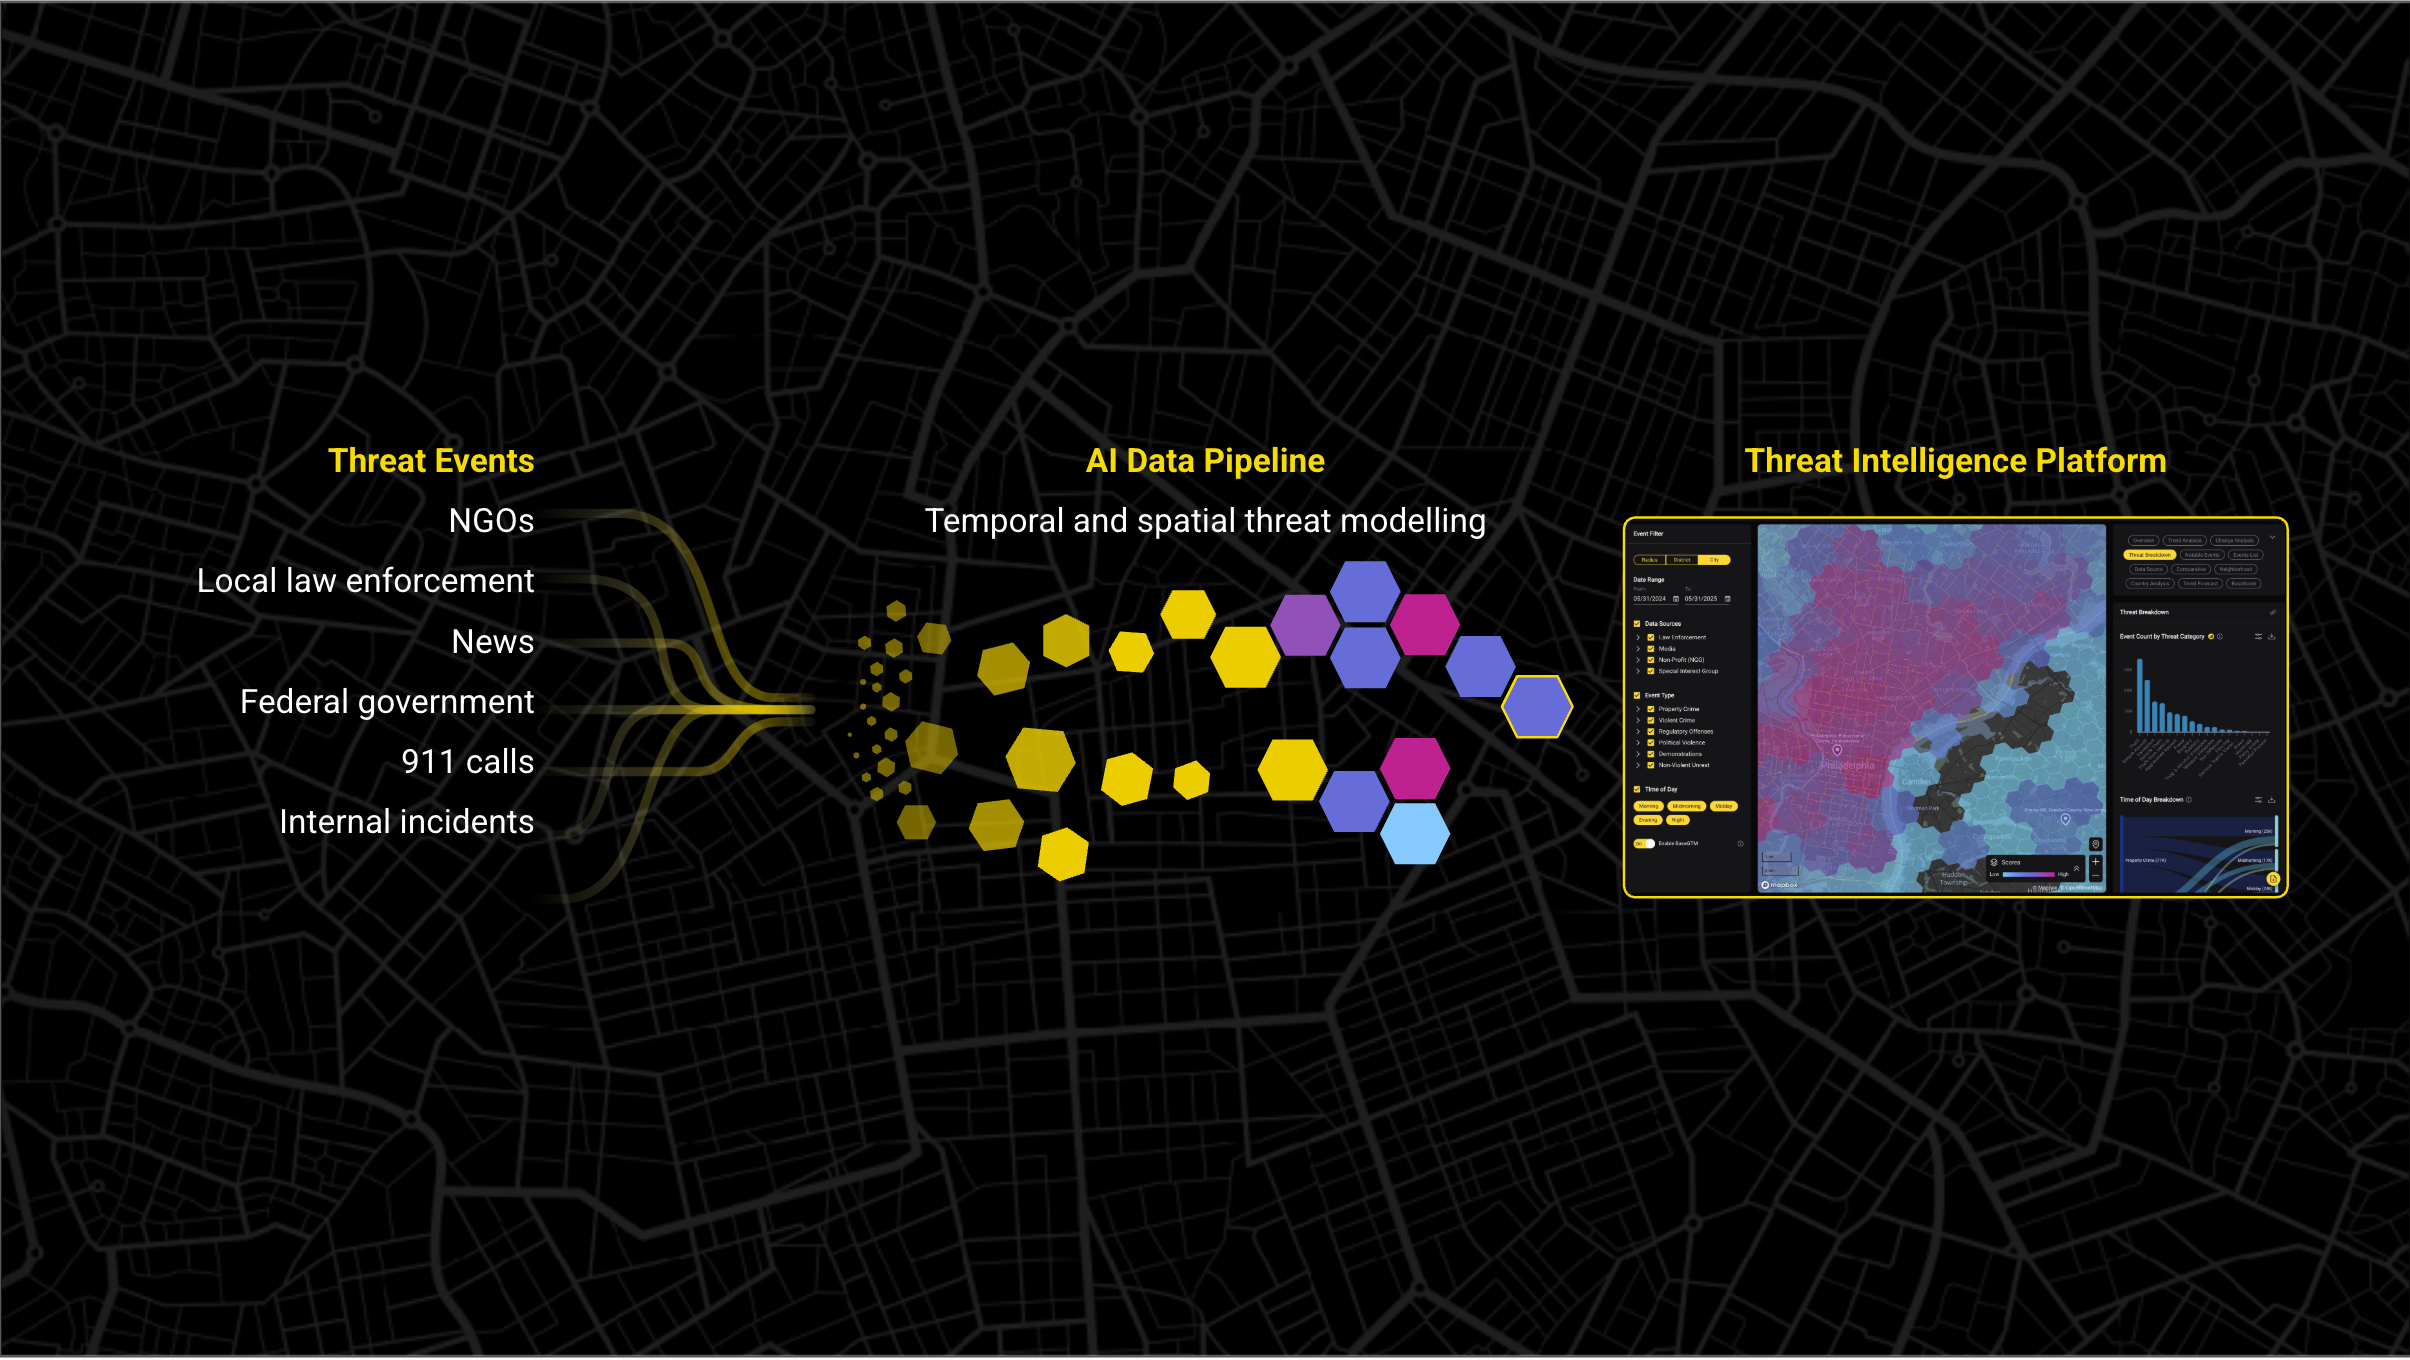
Base Operations delivers crime risk intelligence through a REST/JSON API that returns a BaseScore, a 0-100 risk score, for any address across more than 5,000 global cities, along with a category-level breakdown across 13 crime subcategories and 3 unrest subcategories. The platform draws on more than 25,000 data sources and maps more than 150 million incidents, with crime scoring updated monthly (bi-weekly in some regions) and unrest data updated bi-weekly. Coverage reaches 99% of the US and 95% of the world's leading GDP cities, resolved to sub-mile granularity rather than ZIP code or city level.
Where the five categories above split latency, coverage, and normalization across different vendors, Base Operations is purpose-built for the persistent threat landscape layer: portfolio-wide risk scoring, trend analysis, and batch scoring for large real estate footprints, positioned to complement event-driven alert platforms like Dataminr and Everbridge rather than replace them.
The batch scoring endpoint lets a business intelligence team score an entire portfolio in a single call instead of querying one address at a time. A financial institution managing $5 trillion in assets used this integration to feed change-detection metrics directly into its internal risk models, cutting site assessment time 5x and driving a 300% increase in real estate team requests for risk data. A Fortune 10 company used the same API to bring 500+ locations into one unified threat dashboard, compressing assessment timelines from weeks to hours. A discount retailer applied 0.1-mile radius scoring across its store portfolio and saw security incidents fall 75% within six months. A Fortune 500 CRM software provider's event security team cut venue comparison time from 6 hours to 30 minutes, a 70% reduction in overall event risk assessment time. A global consultancy reported a 35% efficiency gain in threat assessment creation within three months of integrating the API.
Below is a conceptual example of a Base Operations API response for a single location lookup:
{
  "location": {
    "address": "350 5th Ave, New York, NY 10118",
    "latitude": 40.7484,
    "longitude": -73.9857
  },
  "base_score": 62,
  "risk_tier": "Elevated",
  "category_breakdown": {
    "crime": {
      "violent_crime": 58,
      "property_crime": 67,
      "theft": 71
    },
    "unrest": {
      "civil_disturbance": 41
    }
  },
  "last_updated": "2026-08-01",
  "data_sources": 25000,
  "coverage_radius": "sub-mile"
}
This example is illustrative rather than literal API documentation. Security and BI teams evaluating a crime data API integration can request a demo of the Base Operations API, including a walkthrough of endpoint documentation and sample responses.
Crime Data API vs. Manual Risk Assessment: Why Integration Matters
Manual crime risk assessment does not scale with enterprise footprints. A security analyst at a global energy infrastructure company described doing the job of 10 people, spending hours reconciling city-by-city data instead of analyzing it. A National Guard officer preparing site security for a major international sporting event saw manual analysis that took six months replicated by an API-driven platform in five seconds, using preloaded city risk data instead of building a picture from scratch. A global consultancy's security team spent 100% of its capacity on manual data collection, calculating risk scores by hand and maintaining a legacy BI tool that struggled with data accuracy; after switching to an API-driven platform, the team gained back 35% efficiency within three months. A Fortune 500 CRM provider's event security team faced the same math at a smaller scale: manual venue assessments took 2-3 days each, consuming 10-15 days per event, before integration cut that to 6-8 hours per venue. One team member described spending more time building spreadsheets than securing events. Across each of these cases, the gap is not only speed. Manual processes also introduce inconsistent methodology between analysts and regions, where an automated, API-driven feed applies the same scoring logic everywhere.
Frequently Asked Questions About Crime Data APIs for Enterprise Security
What is a crime data API?
A crime data API is a software interface that delivers structured crime incident records or calculated risk scores in a machine-readable format, typically JSON over REST, so businesses can query location risk programmatically rather than collecting data manually from individual police departments. Enterprise security, real estate, insurance, and compliance teams use these APIs to standardize risk data across every location in a portfolio.
What is the best crime data API for enterprise security?
The best crime data API depends on the use case. Free government feeds like the FBI Crime Data Explorer work for historical benchmarking. Commercial aggregators like SpotCrime offer broad, low-cost coverage. Sensor networks like ShotSpotter suit high-risk facility monitoring. Normalized risk scoring platforms, including CAP Index, Precisely CrimeRisk, and Base Operations, fit underwriting and site selection. Global platforms like Dataminr and Everbridge fit event-driven alerting.
How accurate are commercial crime data APIs?
Accuracy varies by methodology, and few vendors publish formal accuracy studies, which is an industry-wide gap. The more useful question is transparency: reliable providers disclose their variable count (CAP Index's CRIMECAST model uses more than 70 variables), data provenance, and validation process, rather than delivering an unexplained score. Enterprise buyers should require vendors to show source material and methodology behind any risk score before using it for budget or underwriting decisions.
What is the difference between crime incidents and crime risk scores?
Crime incidents are raw, individual records of what happened, where, and when, sourced directly from police or sensor data. Crime risk scores are modeled indices that estimate the probability of future risk at a location, calculated from dozens of weighted variables applied to historical incident data. Enterprises use raw incidents for granular investigation and risk scores for benchmarking, ranking, and comparing locations at scale.
Can crime data APIs be integrated into a SIEM or GSOC platform?
Yes. Crime data APIs typically integrate into SIEM and GSOC platforms through a REST pull for on-demand queries, a webhook push for event-driven updates, or a flat-file batch feed for portfolio-wide scoring, often alongside GeoJSON output for GIS and dashboard tools like Esri ArcGIS. A global consultancy's GSOC team, for example, used direct platform access to give field analysts stronger situational awareness during events.
How is enterprise crime data API pricing typically structured?
Enterprise crime data API pricing is typically custom-quoted rather than published, structured around per-query, per-location, flat annual, or volume-tiered models depending on the vendor. Base Operations, for example, prices in three capability-based tiers, Analyst, Enterprise, and Sentinel, scaled by features like dashboard monitoring, API access, and internal data integration rather than a flat per-call rate. Buyers should request a tiered rate card during procurement.
What compliance requirements apply to enterprise crime data APIs?
Enterprise crime data APIs used in employment or housing decisions must comply with the Fair Credit Reporting Act (FCRA) and fair housing law, which prohibits scoring models from using race, religion, or national origin as variables. APIs processing employee or customer data also need to address GDPR and CCPA requirements, and enterprise buyers should confirm SOC 2 Type II compliance for data security before integration.
What is the SpyCloud API and how does it differ from crime data APIs?
SpyCloud is a cybersecurity API focused on dark web monitoring, stolen credential detection, and identity threat intelligence, not physical or geospatial crime data. It answers a different question than a crime data API: SpyCloud tracks whether an organization's credentials have been compromised online, while crime data APIs assess physical safety risk at real-world locations. Enterprises typically use both as part of separate security programs.
Security and risk teams ready to evaluate a crime data API for their own footprint can request a demo or review the API documentation to start integration planning.
Takeaways

Join 1100+ security leaders getting new ideas on how to better protect their people and assets.