How to Scale Security Operations Across Global Locations (Without Expanding Your Team)
Learn how security teams monitor hundreds of global locations without expanding headcount. Real strategies from enterprises managing 400+ sites with small teams.

Security directors at global enterprises face an impossible equation: monitor hundreds or thousands of locations across multiple countries with security teams that wouldn't be large enough to staff a local retail store.
The problem isn't theoretical. It's the daily reality for security leaders trying to provide comprehensive coverage while reporting to CFOs who view security as a cost center rather than a strategic function.
The Director of Crisis Management at a Fortune 500 insurance and risk management company put it plainly: "We only have a team of two to cover the whole world. We're doing what we can with the bandwidth that we currently have, and that is primarily just react and respond."
His company has 15,000 employees across 21 countries. Two security professionals. That's a 7,500:1 employee-to-security-team ratio—and it's not an outlier.
The traditional response to this challenge is straightforward: hire more people. But budget constraints, hiring timelines, and the difficulty of justifying headcount for prevention (rather than response) make that solution unrealistic for most organizations.
This creates a fundamental constraint: security teams default to reactive monitoring because proactive threat assessment requires resources they don't have. They respond to incidents instead of preventing them. They wait for crises instead of anticipating them. Not because they lack skill or commitment, but because they lack bandwidth.
The question isn't whether security teams need more coverage. It's how to achieve comprehensive global monitoring without proportional increases in headcount.
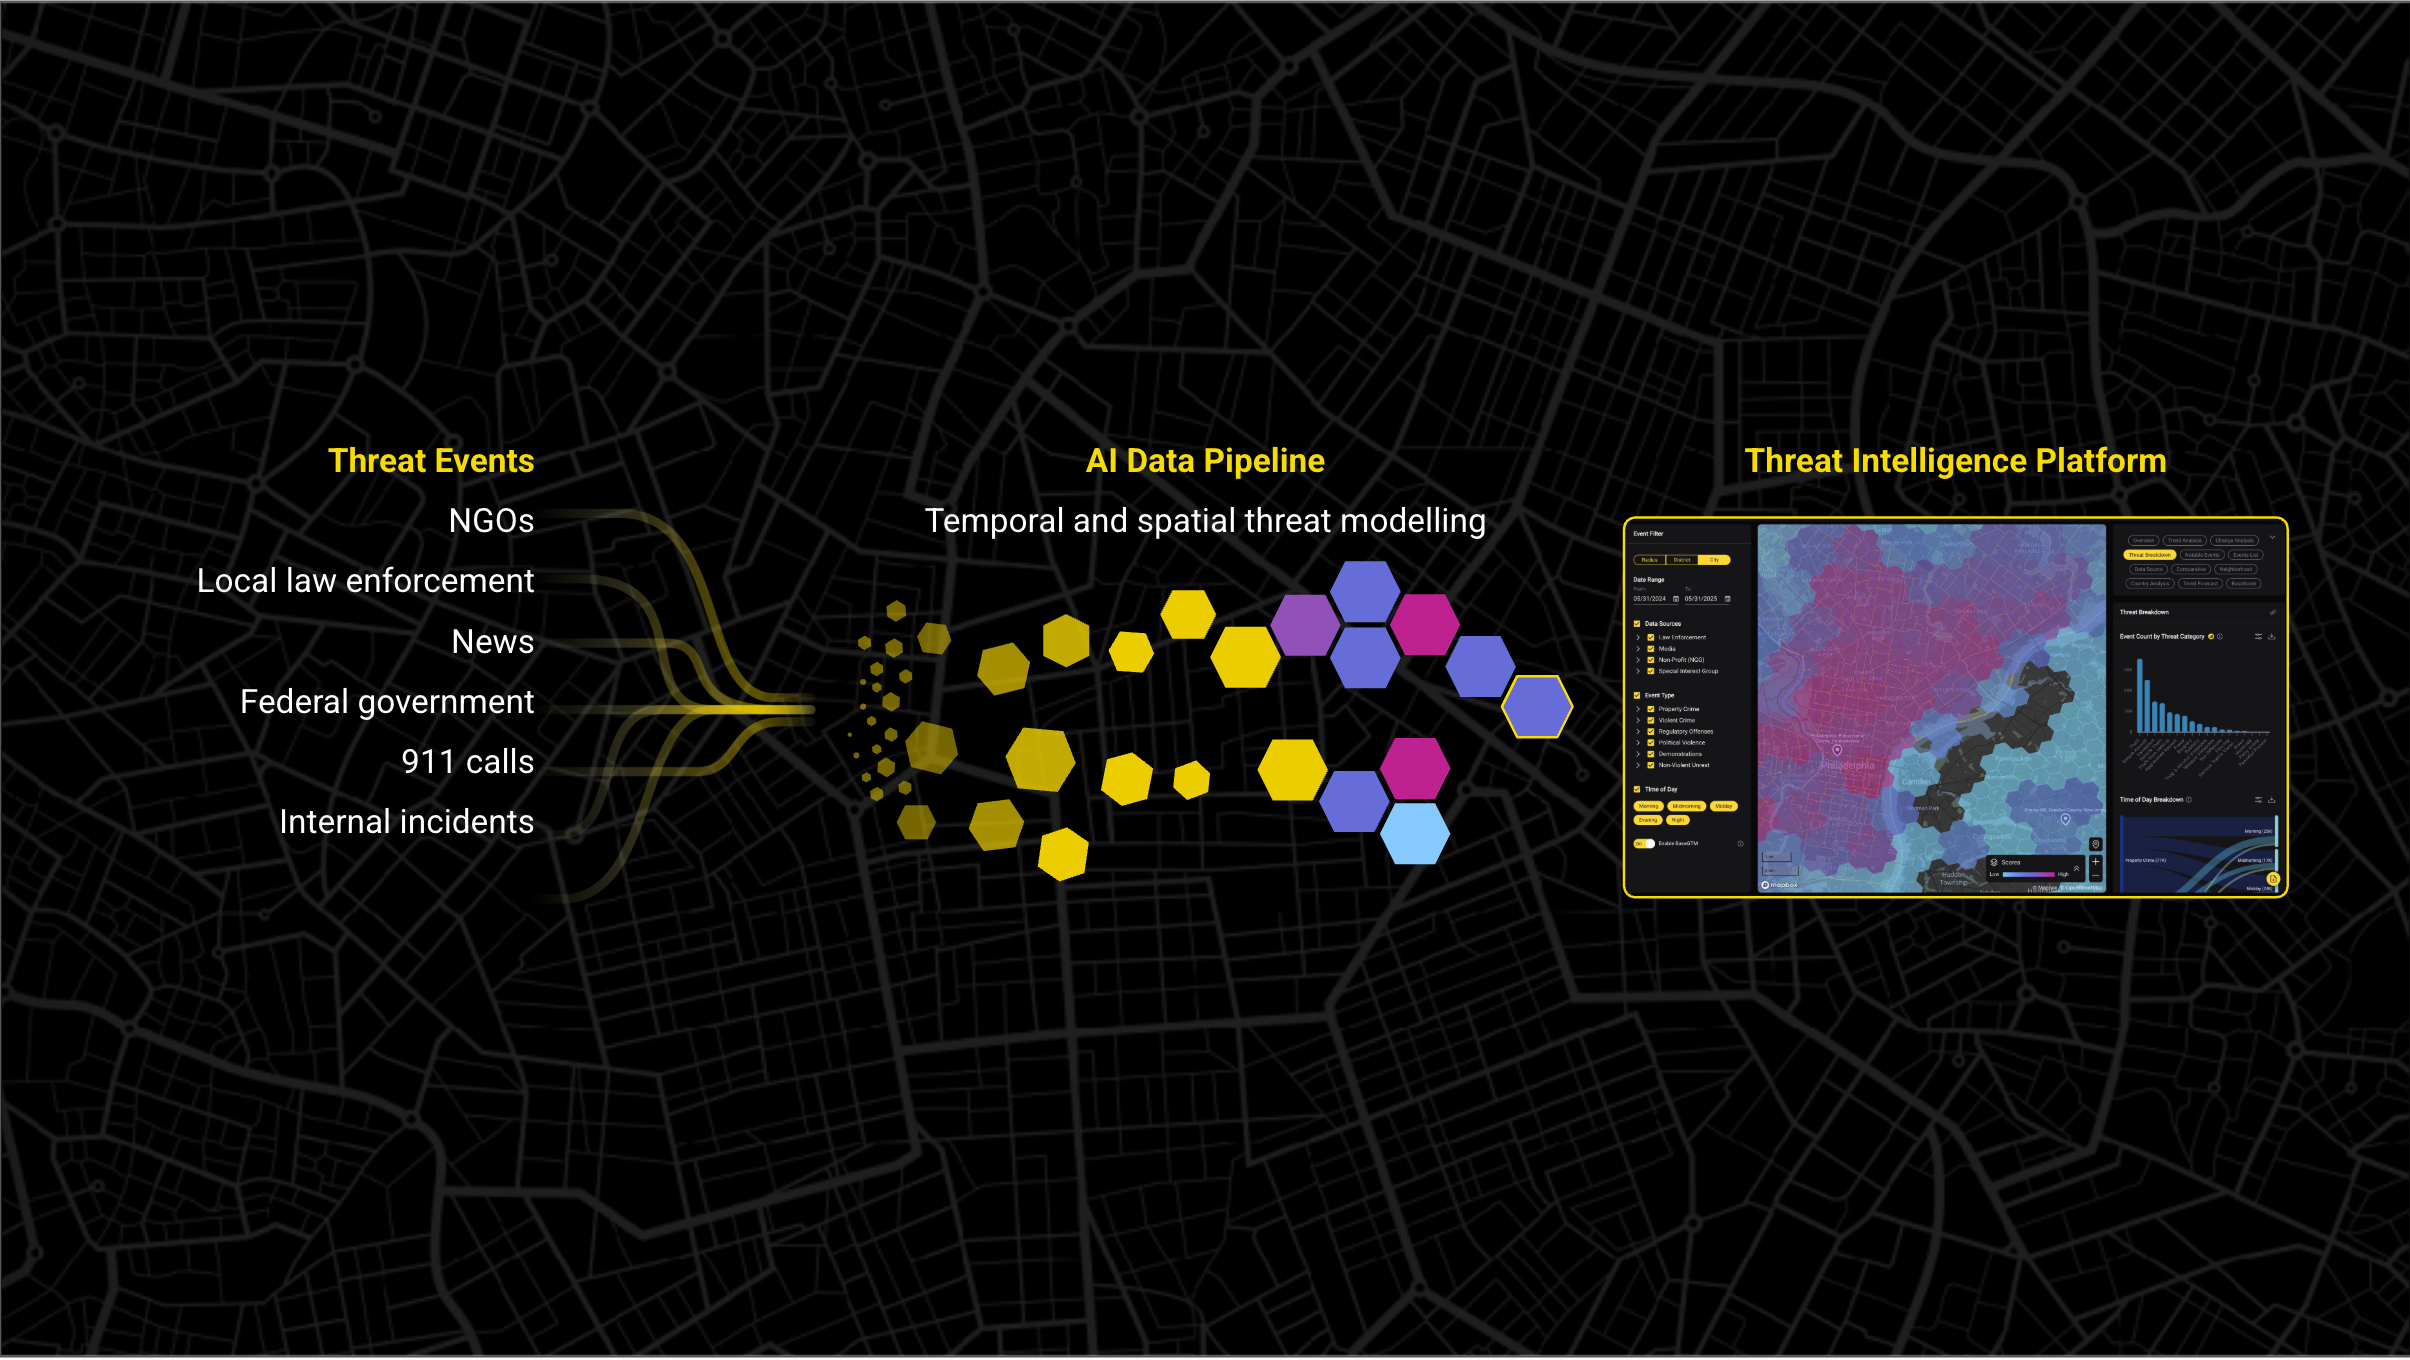
The Real Problem: Manual Processes Don't Scale Geographically
The bandwidth crisis facing global security teams isn't just about headcount. It's about how much time manual processes consume at scale.
Consider what's required to conduct a single location threat assessment:
- Research crime statistics from local law enforcement
- Identify relevant threat patterns by category and timing
- Analyze how neighborhood conditions might impact the location
- Cross-reference internal incident data with external trends
- Document findings and provide actionable recommendations
For one location, this process might take 2-4 hours. Multiply that across hundreds or thousands of locations, and the math becomes impossible.
A security analyst at a Fortune 100 e-commerce and technology company described this exact challenge: "We have been for the past few years, doing this on our own internally. We're starting to get to a point where they want more regular updates, and we're starting to also hit a point where it's taking up a lot of bandwidth when we need to be spending it elsewhere."
The company's security team was manually researching municipal data across 441 global locations. Even for an organization with those resources, the manual approach had reached its breaking point.
This is what unscalable security operations look like: teams that built their processes during expansion now find those same processes prevent them from maintaining coverage as the organization grows. What worked at 50 locations fails at 500.
The resource consumption creates a second-order problem: strategic security work gets deferred. When analysts spend their time collecting data, they can't analyze trends. When directors focus on individual assessments, they can't develop systematic approaches to risk management. The bandwidth crisis doesn't just limit coverage—it prevents security teams from operating strategically.
Organizations face three options: accept coverage gaps, dramatically expand headcount, or fundamentally change how threat intelligence work gets done.
Most choose coverage gaps. Some attempt headcount expansion. But a third approach—operational transformation through automation—enables comprehensive global coverage without proportional resource increases.
What Scalable Global Security Operations Actually Look Like
When security operations scale effectively, the transformation isn't about team size. It's about analyst capacity.
Consider the experience of a major global logistics provider. Their Risk Intelligence team managed quarterly assessments across 400+ North American supply chain routes, each spanning over 500 miles with multiple stops. The manual approach limited them to a 50:1 route-to-analyst ratio.
After implementing automated threat assessment capabilities, that ratio became 200:1. Not through hiring, but through eliminating the manual data collection that consumed analyst bandwidth.
The shift looks like this:
Before: Security analysts spend 70% of their time gathering threat data and 30% analyzing it.
After: Security analysts spend 20% of their time reviewing automated assessments and 80% conducting strategic analysis.
This redistribution of effort has a multiplier effect. Each analyst can now cover 4x more locations, not by working faster, but by working differently. The questions they answer shift from "what happened here?" to "what patterns exist across our portfolio?" and "which locations require priority attention?"
A major discount retailer with 16,000 locations demonstrated this principle at the tactical level. Their security team used automated threat intelligence to analyze crime patterns within a 0.1-mile radius of high-risk stores. The hyperlocal data enabled them to identify specific threat categories by time-of-day and day-of-week.
Armed with this intelligence, they deployed cameras and personnel at statistically high-risk periods. The results: 75% reduction in security incidents over six months and 17% quarterly efficiency increase in site assessment completion time.
The strategic insight isn't just that automation enables better resource deployment. It's that systematic data access enables pattern recognition that manual processes can't achieve at scale.
When security teams manually assess locations one by one, they can't easily compare threat profiles across their portfolio. They can't identify which locations have similar risk characteristics. They can't develop location-specific security models based on neighborhood crime patterns.
Scalable security operations create visibility that enables prioritization. Instead of treating all locations equally (or making gut-feel decisions about which deserve attention), teams can use objective criteria to focus resources on highest-risk environments.
This is what the discount retailer achieved: a standardized Security Playbook that used threat intelligence as the foundation for location-specific security measures. Platform usage among their security personnel increased 17% quarter-over-quarter as teams recognized its value for conducting efficient site assessments and developing customized policies.
The pattern holds across different industries and use cases. Whether it's retail locations, supply chain routes, or employee residential addresses, scalable operations share common characteristics:
- Automated data collection replaces manual research
- Standardized assessments enable portfolio-wide comparison
- Objective risk scoring drives resource prioritization
- Systematic monitoring tracks changes over time
These capabilities don't just help small teams do more. They enable security organizations to operate strategically rather than reactively—even when team size remains constrained by budget realities.
Building Your Scalable Security Intelligence Framework
The transition from location-by-location manual assessment to systematic global monitoring requires more than just adopting new tools. It requires rethinking how security intelligence work gets structured.
The framework has four components:
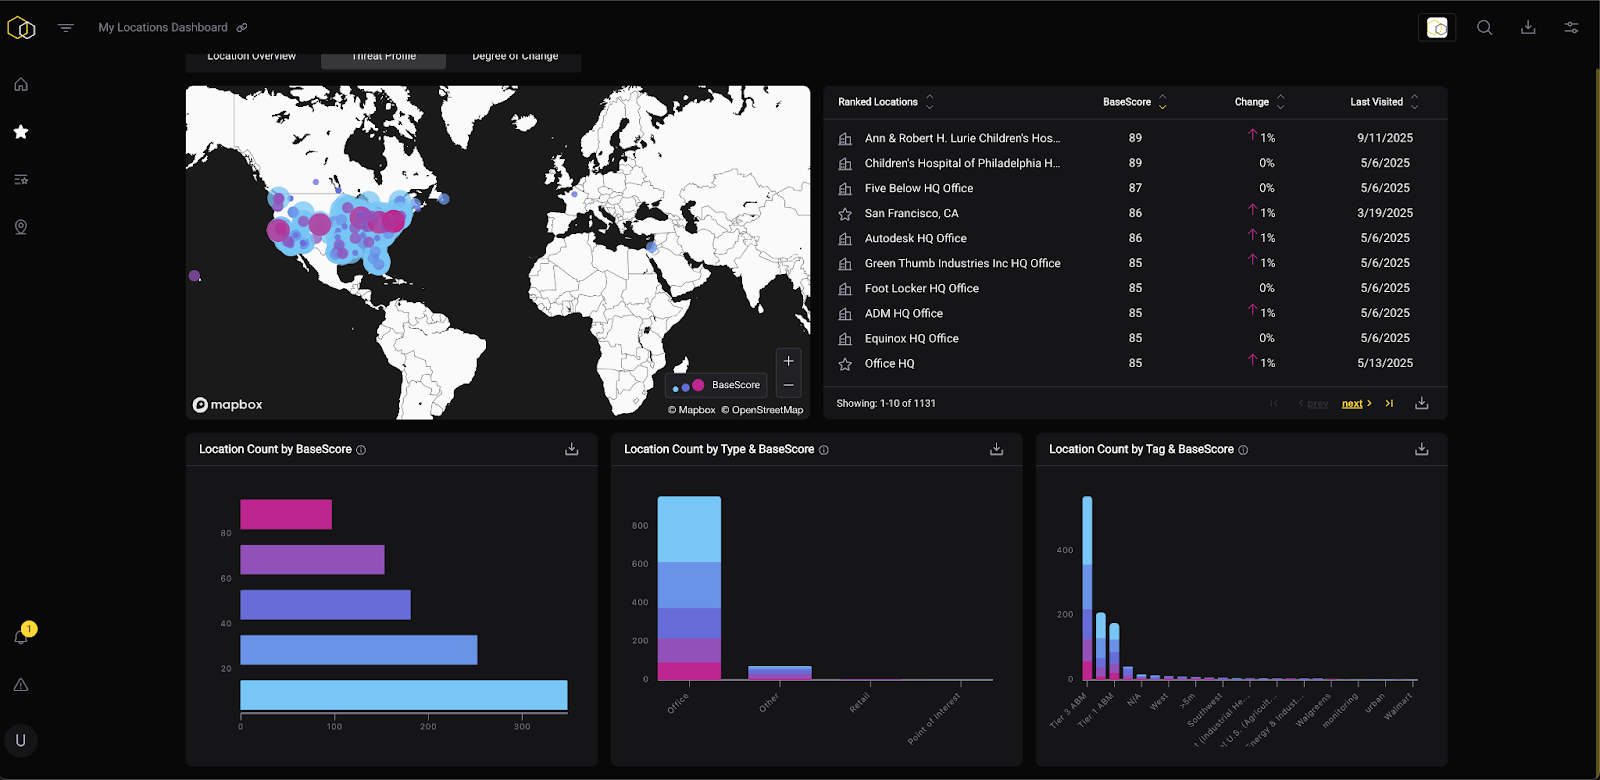
1. Centralize Location Data and Risk Baselines
Start by mapping every location that requires monitoring: office sites, retail stores, warehouses, frequent travel destinations, concentrations of remote employee residences.
For each location, establish a baseline threat assessment that documents:
- Current neighborhood threat profile by category
- Timing patterns (day-of-week, time-of-day risk variations)
- Quantified risk score relative to other areas
- Historical trend direction (improving vs. deteriorating)
The logistics provider accomplished this by uploading key destinations across hundreds of routes into their threat intelligence platform. Within days, they had comprehensive mapping of loading docks, truck stops, and depot points—with automated threat assessments for each.
This initial investment creates the foundation for systematic monitoring. Instead of conducting one-off assessments when specific concerns arise, you maintain continuous visibility across your entire portfolio.
2. Define Risk Thresholds and Priority Tiers
Not all locations require equal attention. Scalable operations depend on clear criteria for prioritizing resources.
Establish risk tiers based on:
- Threat level: What's the baseline risk score?
- Asset criticality: How important is this location to operations?
- Population: How many employees/customers/assets are present?
- Incident history: Has this location experienced security problems?
The discount retailer used this approach to identify high-risk stores that warranted enhanced security measures. Rather than distributing resources evenly across 16,000 locations, they focused on environments where data indicated elevated risk.
Create clear escalation criteria. For example:
- Tier 1 (Monitor): Locations below baseline risk with no concerning trends
- Tier 2 (Active Monitoring): Locations approaching risk thresholds or showing negative trends
- Tier 3 (Enhanced Measures): Locations exceeding risk thresholds requiring additional security resources
This tiered approach enables small teams to focus analyst attention where it matters most while maintaining automated monitoring across all locations.
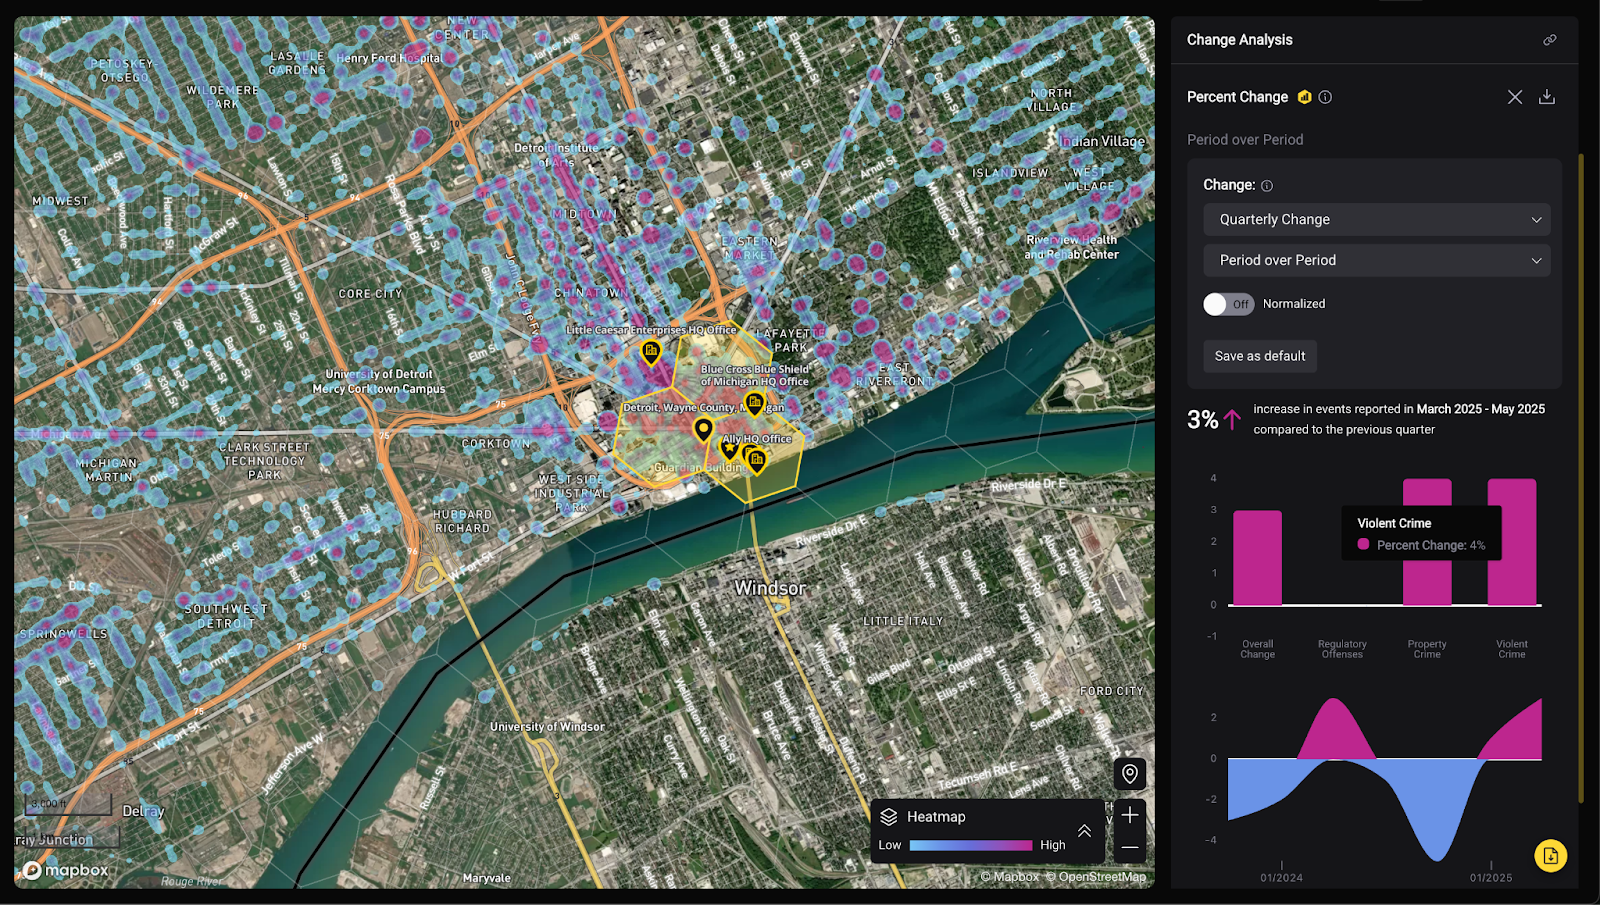
3. Automate Change Detection and Alerting
Static assessments become outdated quickly. Scalable operations depend on automated notification when conditions change.
Configure monitoring to alert your team when:
- Risk scores increase beyond defined thresholds
- New threat patterns emerge in location vicinity
- Crime trends shift significantly month-over-month
- Specific threat categories spike unexpectedly
The discount retailer used this capability to measure a 66% reduction in overall crime within the district surrounding their target location over six months—validating that their security measures were creating positive impact.
Automation doesn't mean eliminating human judgment. It means ensuring analysts receive notification of changes that warrant attention rather than manually checking hundreds of locations for updates.
4. Build Standardized Assessment Templates
Create consistent frameworks for how security intelligence informs decisions:
For site assessments: Template that pulls automated threat data and guides analyst through risk evaluation specific to the location's use case.
For travel security: Briefing format that provides neighborhood analysis around hotels, event venues, and transportation routes.
For resource allocation: Dashboard that displays risk scores across locations to inform where security personnel, technology, or policy changes should be deployed.
The logistics provider evolved this concept into an Advanced Route Analysis framework providing comprehensive risk scores per route with granular alternatives suggesting safer directions for drivers between stops.
Standardization doesn't mean one-size-fits-all security. It means creating efficient processes that still allow for location-specific customization based on automated data rather than manual research.
What This Actually Means for Your Security Budget
The discussion about scaling global security operations inevitably leads to budget conversations. Security directors understand that automation and intelligence platforms aren't free—they require investment approval from CFOs who already view security as a cost center.
This is where most security technology pitches fail. They focus on employee safety and incident prevention, which executives acknowledge as important but struggle to quantify financially.
The crisis management director at the Fortune 500 insurer provided the framework that actually works: "It's gonna impact our workforce, but then it's also gonna impact our policies and claims. So understanding that helps the business run, not necessarily just from a safety and security perspective, but also from a bottom line perspective."
He's talking about dual-use value. Threat intelligence that serves both security operations and business operations. Data that prevents incidents while also informing operational decisions.
For insurance companies, this is explicit: weather and crime data that protects employees also informs claims modeling and risk pricing. For retailers, location threat data that guides security resource deployment also supports real estate expansion decisions. For logistics companies, route risk analysis that protects drivers also optimizes operational efficiency.
This is how security budgets get approved: by demonstrating business impact beyond compliance.
The ROI Case That Actually Resonates
Build your investment justification around three financial realities:
1. Current Process Costs
Calculate what manual threat assessment actually costs:
- Hours per location assessment × fully-loaded hourly analyst cost
- Multiply by number of locations requiring assessment
- Factor in frequency (quarterly, annually, or as-needed basis)
For the e-commerce company's team monitoring 441 global locations, even conservative estimates (2 hours per location at $75/hour fully-loaded cost) equals $66,150 per assessment cycle. Quarterly assessment means $264,600 annually in labor costs just for data collection—before any strategic analysis occurs.
2. Capacity Multiplier Impact
When automation increases analyst capacity 4x (as the logistics provider achieved), that's equivalent to avoiding three additional hires at $120,000+ each—a $360,000+ annual savings even before considering recruiting costs and onboarding time.
More importantly, it enables coverage that's impossible through hiring alone. You can't hire fractional analysts to monitor remote employee residential addresses or occasional travel destinations. Automation makes comprehensive coverage economically feasible.
3. Risk Reduction Quantification
The discount retailer's 75% reduction in security incidents translates to measurable financial impact: fewer theft losses, lower liability exposure, reduced insurance premiums, and avoided operational disruption from security events.
If their average security incident cost is $5,000 (conservative for retail shrinkage, vandalism, and staff safety incidents), and they were experiencing 20 incidents monthly at high-risk locations, that 75% reduction equals $900,000 in annual avoided losses.
Even more compelling: their 66% decrease in neighborhood crime created documented community safety improvement—the kind of impact that supports real estate investment decisions and community relations.
What CFOs Actually Approve
The pattern across organizations that successfully fund security intelligence automation:
They don't pitch security tools. They pitch operational efficiency platforms that happen to serve security use cases.
They don't emphasize preventing theoretical threats. They quantify the cost of current manual processes and demonstrate measurable capacity increases.
They don't request budget for "comprehensive global monitoring." They start with high-priority use cases (protecting executives, securing high-value assets, supporting expansion decisions) where ROI is immediately demonstrable.
The crisis management director said it explicitly: "We don't get the budget for nice-to-haves until they're proven to be need-to-haves, and typically that's normally in a panic reactive space because something went sideways."
But he also revealed the strategic approach that breaks this cycle: "I personally like to do a decent amount of due diligence. I'd rather identify platforms that could have a strong use case for us rather than have an emergency need, and then sign a 3-year deal to save a couple of dollars, and now I'm locked into a product that I didn't do my homework on."
The security leaders who get budget approval understand they're building a business case, not making a security argument. They demonstrate operational value. They quantify efficiency gains. They connect threat intelligence to business decisions beyond incident prevention.
This is how small security teams scale global operations: not by requesting proportional headcount increases, but by proving that systematic intelligence infrastructure creates measurable business value that justifies the investment.
Making the Transition: Where to Start
Moving from manual, location-by-location assessment to systematic global monitoring doesn't require replacing all your processes simultaneously. The most successful implementations start with focused use cases that demonstrate value, then expand systematically.
Phase 1: Prove the Model with High-Priority Locations (Weeks 1-4)
Select 15-25 locations that represent your most pressing coverage needs. This might be:
- Highest-risk retail stores based on incident history
- Office locations in areas where you lack local security contacts
- Frequent executive travel destinations
- New market expansion sites requiring assessment
For this pilot set, implement automated baseline assessments. Document:
- Time saved compared to manual research process
- Quality of intelligence compared to previous methods
- Actionable insights you couldn't have identified manually
- Security decisions informed by the data
The discount retailer started with a single high-risk store experiencing incident rates significantly above average. They used hyperlocal threat intelligence to identify specific crime patterns by time-of-day and day-of-week, then deployed cameras and personnel at statistically high-risk periods. The 55% incident reduction in the first month validated their approach.
This pilot phase builds internal credibility. When you demonstrate measurable impact at priority locations, expanding to comprehensive coverage becomes easier to justify.
Phase 2: Standardize Portfolio-Wide Coverage (Months 2-3)
With proof of concept established, systematize the approach:
Upload all locations requiring monitoring. Create comprehensive mapping of your global footprint. The logistics provider accomplished this by uploading key destinations across hundreds of routes, creating immediate visibility across their entire North American operation.
Establish risk tiers and monitoring protocols. Define which locations warrant ongoing active monitoring versus periodic review. Not every location requires the same attention level.
Configure automated change detection. Set up alerts for threshold breaches and trend changes. This ensures analysts receive notifications of conditions requiring attention rather than manually checking hundreds of locations.
Create standardized assessment templates. Build frameworks that guide how automated intelligence informs different decision types: site assessments, travel security briefings, resource allocation recommendations.
This phase transforms individual location monitoring into systematic portfolio visibility.
Phase 3: Expand to Strategic Applications (Months 4-6)
With foundational coverage established, extend the framework to use cases that deliver broader business value:
Risk-adjusted real estate decisions: Inform expansion, consolidation, and lease renewal decisions with quantified neighborhood threat analysis.
Insurance and liability management: Use documented location risk profiles to support premium negotiations and demonstrate proactive risk mitigation.
Executive protection and travel security: Provide data-backed briefings for leadership travel, replacing generic advisories with location-specific intelligence.
Resource allocation optimization: Use comparative risk scoring across locations to justify security personnel, technology, and budget distribution.
The discount retailer achieved this by developing their Security Playbook—a standardized approach that used threat intelligence as the foundation for location-specific security models. Platform usage increased 17% quarter-over-quarter as teams recognized value for efficient site assessments and customized policy development.
Critical Success Factors
Three elements distinguish successful implementations from failed pilots:
Executive sponsorship beyond the security team. When operations, real estate, or risk management leaders see direct value from threat intelligence, adoption becomes organizational rather than limited to security.
Clear accountability for data-informed decisions. Define who's responsible for reviewing automated assessments, acting on alerts, and maintaining location data. Automation doesn't eliminate the need for human judgment—it amplifies analyst capacity.
Measurable outcomes tracked over time. Document incident reductions, efficiency gains, and cost avoidance. The organizations that successfully scale their security operations treat threat intelligence as a measurable business capability, not a technology implementation.
Most importantly: start. The organizations struggling with impossible coverage equations aren't waiting for perfect conditions or comprehensive budget approval. They're proving the model with focused use cases, then expanding systematically based on demonstrated value.
Why Manual Processes Fail at Scale (And What to Do About It)
The fundamental problem with manual threat assessment isn't quality. Security analysts conducting individual location research often produce excellent work.
The problem is scalability. Manual processes that work for 10 locations become impossible at 100, and completely break down at 1,000.
But organizations don't usually recognize the breaking point until they're past it. The warning signs look like:
Increasing assessment backlogs. Requests for location risk analysis start taking weeks instead of days. Priority assessments jump the queue while routine coverage falls behind.
Coverage gaps rationalized as acceptable. The team stops monitoring certain location categories or geographic regions, not because they're low-risk, but because resources don't allow comprehensive coverage.
Reliance on "gut feel" rather than data. Analysts make security recommendations based on general knowledge rather than specific location analysis because detailed research would take too long.
Reactive instead of proactive posture. The crisis management director described this exactly: "We only have a team of two to cover the whole world. We're doing what we can with the bandwidth that we currently have, and that is primarily just react and respond."
The logistics provider faced this same constraint before automation: a 50:1 route-to-analyst ratio that limited comprehensive coverage. Security teams spent significant time sourcing and correlating data from disparate crime databases, truck depot security reports, and regional threat feeds. Manual processes prevented them from expanding analysis capabilities to match the company's growing operational demands.
When manual approaches fail, organizations face three choices:
Option 1: Accept Coverage Gaps
This is the most common response. Security teams continue operating with known limitations:
- Some locations receive regular assessment, others get spot-checked
- High-profile situations get thorough analysis, routine decisions rely on general guidance
- The team knows they're missing emerging threats but lacks capacity to proactively monitor
This approach feels pragmatic—work with the resources you have—but creates accumulating risk. The gaps aren't random; they're systematic. Locations that don't demand attention often don't receive it until an incident forces review.
The real cost isn't obvious until something happens at an "uncovered" location. Then the question becomes: would this incident have been preventable with better threat intelligence?
Option 2: Dramatically Expand Headcount
Some organizations attempt to solve the scale problem through proportional hiring. If two analysts can monitor 100 locations, hire twenty analysts to monitor 1,000 locations.
This approach rarely succeeds because:
Security headcount doesn't scale linearly with locations. Administrative overhead, coordination complexity, and knowledge sharing requirements increase faster than coverage capacity.
Budget approval for prevention is extremely difficult. The crisis management director explained the dynamic: "We don't get the budget for nice-to-haves until they're proven to be need-to-haves, and typically that's normally in a panic reactive space because something went sideways."
Hiring timelines don't match operational needs. By the time you identify the coverage gap, get headcount approved, recruit candidates, and onboard them, your location footprint has often expanded further.
More fundamentally, the hiring approach treats the symptom (insufficient coverage) rather than the cause (unscalable manual processes). You're adding people to do inefficient work rather than making the work itself more efficient.
Option 3: Transform How Intelligence Work Gets Done
The third option—operational transformation through automation—is what successful global security teams actually do.
This doesn't mean eliminating security analysts. It means changing what analysts spend their time doing.
Before transformation:
- 70% of time: gathering raw data from multiple sources
- 20% of time: organizing and formatting information
- 10% of time: analyzing patterns and developing recommendations
After transformation:
- 20% of time: reviewing automated assessments and validating findings
- 30% of time: conducting comparative analysis across locations
- 50% of time: developing strategic recommendations and security frameworks
The logistics provider exemplified this shift. Automated threat assessment helped them scale capacity 4x, transforming their route-to-analyst ratio from 50:1 to 200:1. The same team could now provide comprehensive coverage across their entire North American footprint without sacrificing analysis quality.
But the impact went beyond efficiency. The automated framework enabled them to develop Advanced Route Analysis capabilities providing granular risk scores per route with safer alternatives for drivers. During RFPs for long-term freight arrangements, these advanced security capabilities became value-add incentives for customers—competitive differentiation in their 3PL services.
This is what operational transformation actually means: security teams evolving from reactive responders conducting individual assessments to strategic advisors operating systematic intelligence frameworks.
The transition requires investment—not just in technology, but in rethinking how security intelligence work gets structured. But organizations that make this shift solve the scale problem permanently rather than temporarily patching it with additional headcount.
What Success Looks Like: Real Metrics from Teams That Made the Transition
When security operations scale effectively, the results are measurable. Not just in analyst sentiment or operational "feel," but in concrete performance metrics that demonstrate capacity expansion and risk reduction.
Capacity Metrics: How Much More Coverage Can Your Team Provide?
Global 3PL (Logistics Provider):
- Starting point: 50:1 route-to-analyst ratio, ~400 routes requiring quarterly assessment
- After implementation: 200:1 route-to-analyst ratio, same team covering 4x the routes
- Business impact: Security capabilities became competitive differentiator in customer RFPs; new freight contracts secured by offering advanced route security analysis
The transformation wasn't just about covering more routes. The automated framework enabled development of Advanced Route Analysis providing granular risk scores and safer direction alternatives for drivers—a capability that would have been impossible to develop while analysts were consumed with manual data collection.
Fortune 100 E-Commerce and Technology Company:
- Starting point: Security team manually researching municipal data across 441 global locations
- Challenge identified: "Taking up a lot of bandwidth when we need to be spending it elsewhere"
- Implementation approach: Automated threat assessment generation with 5-mile radius analysis at each location
The bandwidth crisis this company faced represents a common pattern: organizations that built their security processes during expansion find those same processes prevent them from maintaining coverage as they grow.
Risk Reduction Metrics: What Security Outcomes Improve?
Major Discount Retailer (16,000 locations):
- 75% reduction in security incidents over 6 months at target locations after implementing data-driven security measures
- 66% decrease in neighborhood crime achieved through enhanced data sharing and collaboration with local law enforcement
- 17% quarterly efficiency increase in time taken to complete site assessments and tailor security policies for each site
Perhaps more significant than the incident reduction: their success led to fundamental organizational transformation. They developed a standardized Security Playbook with threat intelligence as the core platform. Platform usage among security personnel increased 17% quarter-over-quarter as teams recognized value for conducting efficient assessments and developing customized policies.
The Director of Security explained the insight that drove their approach: "The key was finding a way to visualize and anticipate threats before they impacted our location."
They achieved this by analyzing crime data within a 0.1-mile radius of high-risk stores, identifying specific crime patterns by time-of-day and day-of-week, then deploying cameras and personnel at statistically high-risk periods. Hyperlocal data enabled precision that broad-area statistics couldn't support.
Process Efficiency Metrics: How Much Faster Can Assessments Get Completed?
The discount retailer's 17% quarterly efficiency gain in site assessment completion represents measurable analyst productivity increase. But the efficiency impact shows up across multiple workflow areas:
Assessment completion time:
- Manual approach: 2-4 hours per location for comprehensive threat analysis
- Automated approach: 15-30 minutes to review generated assessment and add context
Portfolio-wide monitoring:
- Manual approach: Quarterly spot-checks of priority locations, with most sites unmonitored between assessments
- Automated approach: Continuous monitoring across all locations with automated alerts via APIs for threshold breaches
Strategic analysis capacity:
- Manual approach: Individual location assessments with limited pattern recognition across portfolio
- Automated approach: Comparative analysis identifying locations with similar risk characteristics and developing location-specific security models
Financial Impact Metrics: What's the Business Value?
The discount retailer's 75% incident reduction translates directly to financial impact:
- Reduced theft losses and inventory shrinkage
- Lower liability exposure from security events
- Decreased insurance premiums
- Avoided operational disruption costs
If their average security incident costs $5,000 (conservative for retail), and they were experiencing 20 incidents monthly at high-risk locations, that 75% reduction equals $900,000 in annual avoided losses.
The logistics provider's competitive differentiation in customer RFPs represents another financial impact category: revenue protection and growth. When advanced security capabilities become deal-winning factors in long-term freight arrangements, threat intelligence transitions from cost center to revenue contributor.
The Pattern Across Successful Implementations
Organizations that successfully scale security operations share common measurement approaches:
They quantify current-state costs. Before implementation, they document time spent on manual processes and calculate fully-loaded costs of that analyst effort.
They track capacity expansion. They measure how many more locations can receive coverage with the same team, or how much time gets freed for strategic work.
They monitor risk outcomes. They track incident rates at monitored locations and measure changes over time—but they also track positive indicators like community crime trends and security measure effectiveness.
They document business impact. They connect security improvements to operational outcomes: real estate decisions informed by data, insurance premiums reduced through documented risk mitigation, competitive advantages in customer negotiations.
Perhaps most importantly, they avoid the trap of treating security automation as a technology implementation. They measure it as an operational transformation—one that changes how intelligence work gets done and expands what security teams can accomplish without proportional resource increases.
The Path Forward
The security teams successfully operating at global scale aren't waiting for budget approval to triple their headcount. They're not accepting coverage gaps as inevitable. And they're not spending 70% of analyst time manually gathering data that technology can provide systematically.
They've recognized that the traditional approach—where location coverage scales proportionally with team size—breaks down when organizations operate across hundreds or thousands of sites. The math simply doesn't work.
The crisis management director at a Fortune 500 insurer managing 15,000 employees across 21 countries with a two-person security team. The logistics provider covering 400+ routes spanning over 500 miles each. The discount retailer monitoring 16,000 locations across diverse urban and rural environments.
These aren't outliers. They're the normal operational environment for enterprise security.
What's changed is that systematic threat intelligence infrastructure now enables comprehensive coverage that manual processes can't achieve. Not through working harder or faster, but through working differently.
The organizations that make this transition aren't just solving today's coverage problem. They're building security operations that scale as the enterprise grows—without requiring proportional increases in budget, headcount, or analyst workload.
The Director of Security at the discount retailer put it simply: "The key was finding a way to visualize and anticipate threats before they impacted our location."
For small security teams covering global operations, that capability isn't a luxury. It's the difference between reactive incident response and proactive risk management. Between coverage gaps and comprehensive monitoring. Between security as a cost center and security as a strategic function.
The question isn't whether your team needs better coverage across global locations. It's whether you'll address that need by continuing manual processes that don't scale, requesting headcount increases that won't be approved, or transforming how intelligence work gets structured to enable systematic global monitoring.
The teams that figure this out first aren't just protecting their organizations better. They're creating competitive advantages, supporting growth decisions, and demonstrating measurable business value that transforms how executives view security operations.
That transformation starts with recognizing an uncomfortable truth: the approach that got your security program to its current state won't sustain it at the scale your organization is heading.
And it continues with a focused first step: proving that automated threat intelligence can deliver better coverage, faster assessments, and more actionable insights than manual processes—starting with your highest-priority locations.
The organizations already operating systematically at global scale started exactly there. Not with comprehensive transformation, but with focused pilots that demonstrated value. Then they expanded systematically based on proven outcomes.
Your team doesn't need to be bigger. It needs to operate differently.
The question is whether you'll make that transition proactively—while you still have bandwidth to implement it strategically—or reactively, during a crisis when something goes wrong at a location that wasn't receiving adequate monitoring.
The teams that successfully scale their operations understand that choice isn't theoretical. It's the decision that determines whether small security teams keep pace with global growth or get left behind trying to manage it manually.
For more insights on securing CFO buy-in for security initiatives, explore how leading security directors build compelling business cases that resonate with financial stakeholders.
Frequently Asked Questions
How many locations can a security analyst realistically monitor?
Traditionally, security analysts could maintain detailed coverage of 25-50 locations through manual assessment processes. With automated threat intelligence platforms, this ratio increases significantly. For example, a global logistics provider increased their coverage from 50 routes per analyst to 200 routes per analyst—a 4x capacity expansion without additional headcount. The key factor isn't the raw number of locations, but whether the analyst is spending time gathering data (unscalable) or analyzing automated assessments (scalable).
What's the typical security team to employee ratio for global companies?
Global enterprises often operate with surprisingly small security teams relative to their workforce size. Examples include a Fortune 500 insurance company with 15,000 employees across 21 countries staffed by a 2-person crisis management team, and retail operations with 16,000+ locations managed by a director and five regional analysts. These ratios (7,500:1 and 3,200:1 respectively) are common because security is frequently viewed as a cost center rather than strategic function. Organizations that successfully scale operations do so through operational efficiency rather than proportional headcount increases.
How long does it take to implement automated threat monitoring?
Implementation timelines vary by scope, but successful deployments follow a phased approach. Initial pilots covering 15-25 high-priority locations can demonstrate value within 2-4 weeks. Portfolio-wide coverage typically takes 2-3 months to systematize, including uploading all locations, establishing risk tiers, and configuring automated alerts (via API). Strategic expansion to use cases like risk-adjusted real estate decisions and executive protection occurs in months 4-6. A discount retailer saw 55% incident reduction at their target location within the first month, while a logistics provider achieved their 4x capacity increase within the first quarter.
What are the cost savings of automating security assessments?
Cost savings come from three sources: eliminated manual labor, increased analyst capacity, and reduced security incidents. For manual assessment labor, calculate hours per location (typically 2-4 hours) multiplied by fully-loaded analyst cost ($75-100/hour) across all locations requiring coverage. For a team monitoring 441 locations quarterly, this represents $264,600 annually just for data collection. Capacity multipliers that enable 4x coverage are equivalent to avoiding three additional hires at $120,000+ each ($360,000+ annual savings). Incident reduction provides direct financial impact—a 75% reduction in security incidents averaging $5,000 each can equal $900,000 in annual avoided losses for high-volume retail operations.
How do you convince executives to invest in security automation?
Budget approval requires demonstrating business impact beyond employee safety. Successful security leaders position threat intelligence as operational efficiency platforms that serve multiple business functions. Frame the investment around three financial realities: (1) Calculate current manual process costs showing labor spent on data collection, (2) Demonstrate capacity multiplier impact equivalent to avoided headcount expansion, and (3) Quantify risk reduction in financial terms (avoided losses, reduced insurance premiums, protected revenue). Focus on dual-use value—how the same intelligence that protects employees also informs claims modeling, real estate decisions, and operational planning. Start with high-priority use cases where ROI is immediately demonstrable rather than requesting comprehensive coverage upfront.
What makes location threat monitoring "scalable"?
Scalable security operations share four characteristics that distinguish them from manual approaches: (1) Automated data collection replaces analyst time spent researching crime statistics and threat patterns from disparate sources, (2) Standardized assessments enable portfolio-wide comparison rather than treating each location as a unique research project, (3) Objective risk scoring drives resource prioritization based on data rather than gut-feel decisions about which locations deserve attention, and (4) Systematic monitoring tracks changes over time through automated alerts via API rather than periodic manual checks. The transition from scalable to unscalable occurs when the processes that worked at 50 locations break down at 500—typically because manual research time doesn't compress as location counts increase.
Can small security teams really monitor thousands of locations effectively?
Yes, but only by fundamentally changing how intelligence work gets structured. Manual location-by-location assessment doesn't scale—what works for 10 locations becomes impossible at 100 and completely breaks down at 1,000. However, automated threat intelligence platforms enable comprehensive monitoring by shifting analyst work from data gathering (70% of time in manual approaches) to strategic analysis (80% of time in automated approaches). A discount retailer successfully monitors 16,000 locations with a director and five regional analysts. A logistics provider covers 400+ routes spanning 500+ miles each with a small risk intelligence team. These organizations don't have proportionally larger teams—they have systematically different approaches to how monitoring work gets accomplished.
How do you prioritize which locations need the most security attention?
Effective prioritization requires clear risk tiers based on quantified criteria rather than reactive responses to incidents. Establish tiers using four factors: (1) Threat level measured by baseline risk score, (2) Asset criticality based on operational importance, (3) Population including employee, customer, or asset concentrations, and (4) Incident history showing locations that have experienced security problems. Define escalation criteria such as Tier 1 (baseline monitoring for locations below risk thresholds), Tier 2 (active monitoring for locations approaching thresholds or showing negative trends), and Tier 3 (enhanced measures for locations exceeding thresholds requiring additional security resources). This tiered approach enables small teams to focus analyst attention where data indicates highest risk while maintaining automated monitoring across all locations.
What security metrics indicate successful global scaling?
Track four categories of metrics to measure operational transformation: (1) Capacity metrics showing location-to-analyst ratios and coverage expansion (successful implementations achieve 3-4x increases), (2) Risk reduction metrics tracking incident rates, response effectiveness, and community crime trends (one retailer achieved 75% incident reduction over six months), (3) Process efficiency metrics measuring assessment completion time and portfolio-wide monitoring capability (17% quarterly efficiency gains are typical), and (4) Financial impact metrics quantifying avoided losses, reduced insurance costs, and business value from informed real estate or operational decisions. Organizations that successfully scale avoid treating automation as a technology implementation and instead measure it as operational transformation that expands what security teams accomplish without proportional resource increases.
What's the biggest mistake organizations make when trying to scale security operations?
The most common failure is attempting to solve the scale problem through proportional headcount expansion rather than operational transformation. Organizations recognize they need better coverage and request additional analysts to monitor more locations manually. This approach fails because: (1) Security headcount doesn't scale linearly with locations due to coordination complexity, (2) Budget approval for prevention-focused security hiring is extremely difficult, and (3) By the time hiring completes, location footprints have often expanded further. The underlying problem isn't insufficient people—it's unscalable manual processes. Organizations that successfully scale operations recognize they need to change how intelligence work gets structured, not just add people to do inefficient work faster. This requires investment in automation and systematic frameworks, but solves the scale problem permanently rather than temporarily patching it with additional analysts.
Takeaways

Join 1100+ security leaders getting new ideas on how to better protect their people and assets.