Security Risk Assessment Methodology: The Complete Framework Guide
A security risk assessment methodology is a structured, repeatable process for identifying threats, analyzing vulnerabilities, and quantifying risk using the formula Risk = Threat x Vulnerability x Consequence. This guide covers the 7-step assessment process, compares 5 primary methodologies (qualitative, quantitative, semi-quantitative, asset-based, and threat-based), and provides risk scoring matrices and framework selection guidance for NIST, ISO, FAIR, and OCTAVE.

Security Risk Assessment Methodology: The Complete Framework Guide
What Is a Security Risk Assessment Methodology?
Definition: A security risk assessment methodology is a structured, repeatable process for identifying threats, analyzing vulnerabilities, and quantifying risk to produce a prioritized risk register and risk treatment plan.
The core formula is: Risk = Threat x Vulnerability x Consequence.
A threat is any circumstance or event with the potential to harm an asset. A vulnerability is a weakness that a threat can exploit. Consequence (or impact) is the damage that results when a threat successfully exploits a vulnerability. The methodology provides the rules for how you identify each variable, measure it, combine the scores, and document the results.
This is not the same as a security audit, which checks compliance against a fixed control set. It is not a vulnerability scan, which catalogues technical weaknesses without scoring business impact. And it is not a compliance checklist, which confirms requirements are met without assessing likelihood or prioritizing treatment. A physical security risk assessment methodology does all three and produces a defensible, prioritized register that decision-makers can act on.
Without documented methodology, assessments become inconsistent across regions. One financial institution found that each assessment "required a full week to complete" with "data collection that was manual and inconsistent across regions," producing analysis that "lacked the granularity needed to differentiate between areas within the same city." As one pharmaceutical security director described: "Not all parts of a country are the same. If we're just assigning a blanket risk score across the country, you're not really getting the full picture."
Why Methodology Matters More Than Tools
Organizations that skip methodology and rely on scanning tools or vendor dashboards alone miss process-level, human, and physical vulnerabilities. The UK National Cyber Security Centre (NCSC) emphasizes in its risk management guidance that any risk assessment approach must be documented, reproducible, and defensible across assessors. Tools inform the methodology. They do not replace it.
Three patterns illustrate the failure mode.
The custom risk model trap. One pharmaceutical manufacturer described building a proprietary scoring system: "We currently have our own risk model, and we plug in a proprietary risk score from a bunch of different vendors" into a Power BI dashboard, with custom weights assigned to each vendor score. The result was a model that only one team understood, required constant maintenance, and could not be audited by anyone outside the group.
Incompatible datasets across regions. The same organization described the multi-vendor problem: "We want to look at how close we can get to the single pane of glass, instead of having to look at different tools. When you have a left in one area but your vendor in Europe reports on things differently, your scores don't talk to each other."
Every assessment built from scratch. At a major financial services firm, an analyst described the operational reality: "Corporate America moves at breakneck speed. I was asked 'how are we looking at this,' and then as I'm pulling the information, I'm getting 'do you have an update yet?'" Without a documented, repeatable process, every ad hoc request becomes a new research project.
The 5 Core Components of Any Security Risk Assessment Methodology
Every security risk assessment methodology, regardless of framework, contains five core components. These answer the top practitioner question: "What are the 5 steps of security risk assessment?"
1. Asset Identification. Catalogue what you are protecting: people, physical facilities, data, equipment, supply chain routes, and intellectual property. Assign a criticality rating to each asset. A Fortune 10 enterprise conducting return-to-office risk assessments identified 500+ locations, including commuter routes, transit stops, and parking facilities as distinct assets requiring individual assessment.
2. Threat Identification. Determine what could harm each asset. Threats include adversarial actors (theft, vandalism, workplace violence), natural hazards (flooding, earthquakes), technical failures (power outages, system crashes), and civil unrest. The Fortune 10 case required analyzing "crime patterns, transit safety, and local crime patterns" for each location, identifying threats that varied significantly block by block.
3. Vulnerability Analysis. Assess which weaknesses a threat could exploit. Vulnerabilities include inadequate access controls, insufficient lighting, lack of surveillance coverage, poor perimeter barriers, and gaps in security staffing. In the Fortune 10 example, analysts found "inconsistent threat analysis across different cities" because there was "no single view of risk patterns" across their portfolio.
4. Likelihood and Impact Estimation. Score how probable each threat-vulnerability pair is and how severe the consequence would be. Likelihood accounts for historical frequency, current conditions, and threat actor capability. Impact measures harm across dimensions: physical safety, financial loss, operational disruption, and reputational damage.
5. Risk Treatment and Documentation. Based on scores, assign a treatment strategy (accept, mitigate, transfer, or avoid) and document the decision in a risk register. The Fortune 10 team moved from "manual data collection from multiple sources" and "assessment cycles taking weeks" to a structured process producing proactive route optimization and targeted security investments across their footprint.
The 7-Step Security Risk Assessment Process
The five components above describe what a methodology covers. The seven steps below describe the operational process a practitioner executes, from scoping through final documentation.
Step 1: Define Scope and Objectives
Input: Business context, stakeholder requirements, regulatory obligations.
Output: Scope statement defining assets, locations, time frame, and assessment boundaries.
Common Pitfall: Scope creep. Starting with "assess everything" guarantees nothing gets assessed thoroughly. A Fortune 500 event security team scoped their assessment precisely: "primary event venues, backup sites, executive accommodation, transportation hubs, entertainment venues." That specificity enabled a 24-hour implementation.
Step 2: Build Asset Inventory
Input: Scope statement, facility records, organizational charts.
Output: Asset register with criticality classifications.
Common Pitfall: Ignoring intangible assets. People, brand reputation, and intellectual property are assets. The event security team built a "custom labeling system organizing all event-related sites by type and risk level," ensuring nothing was missed.
Step 3: Identify Threats and Threat Actors
Input: Asset register, threat intelligence feeds, historical incident data.
Output: Threat catalogue listing threat sources, events, and affected assets.
Common Pitfall: Relying on a single data source. A healthcare security analyst described the problem: "I have to go through the LAPD's giant JSON file, and there's just a lot of reporting coming in from different places. There's never really a way to know if these are conflated numbers." Threat identification requires multi-source validation to avoid both duplicates and blind spots.
Step 4: Assess Vulnerabilities and Predisposing Conditions
Input: Threat catalogue, site survey data, control inventory.
Output: Vulnerability register with exposure ratings.
Common Pitfall: Assessing only technical vulnerabilities. A predisposing condition is any pre-existing state that increases risk, such as high employee turnover, geographic isolation, or proximity to high-crime areas.
Step 5: Determine Likelihood and Impact
Input: Vulnerability register, historical data, threat intelligence.
Output: Likelihood and impact ratings for each threat-vulnerability pair.
Common Pitfall: Confusing frequency with probability. A threat that occurred zero times last year is not a zero-likelihood threat. Likelihood must account for capability, intent, and opportunity, not just historical occurrence.
Step 6: Calculate Risk Score and Prioritize
Input: Likelihood and impact ratings, organizational risk criteria.
Output: Prioritized risk register with scores.
Common Pitfall: Spending more time on the scoring system than on the assessment itself. One event security team was "spending more time building spreadsheets and comparing threats than actually securing events." Before their process overhaul, each location required "2 to 3 days" of assessment. Afterward: "6 to 8 hours" per venue using standardized scoring with "instant venue comparisons."
Step 7: Develop Risk Treatment Plan and Document Residual Risk
Input: Prioritized risk register, budget constraints, organizational risk appetite.
Output: Risk treatment plan, residual risk documentation, executive briefing.
Common Pitfall: Treating the assessment as complete when the register is built. Without a treatment plan and documented residual risk, the register is a list, not a decision tool.
Residual risk is the risk remaining after treatment controls are applied. Every residual risk entry must include an acceptance rationale, an authorized approver, and a re-evaluation date.
The 5 Primary Security Risk Assessment Methodologies Compared
Five methodologies dominate practitioner conversations. Each answers the risk question differently.
Qualitative. Uses descriptive scales (High, Medium, Low) based on expert judgment. Fastest to implement, requires no historical data, and works well for initial assessments. Limited by subjective bias and difficulty comparing results across assessors. Aligns with ISO/IEC 27005 and NIST SP 800-30.
Quantitative. Uses mathematical formulas to express risk in dollar values. Annualized Loss Expectancy (ALE), loss-exceedance curves, and Monte Carlo simulations produce financial figures that CFOs understand. Requires extensive, mature data. Aligns with FAIR (Factor Analysis of Information Risk).
Semi-Quantitative. Uses numeric scales (1 to 5 or 1 to 10) that translate into categories. Bridges qualitative judgment with numeric rigor. Aligns with NIST SP 800-30 and most GRC platforms.
Asset-Based. Starts from the asset inventory and works outward to identify threats relevant to each asset. Comprehensive for known assets, but can miss threats that do not map neatly to a specific asset. Aligns with ISO/IEC 27005 and OCTAVE Allegro.
Threat-Based. Starts from the threat landscape and works inward to identify which assets each threat could affect. Strong for dynamic environments where threats change faster than asset inventories. Aligns with MITRE ATT&CK and CISA THIRA.
A note on the "5 C's of risk assessment." Some practitioner training materials reference Context, Consequences, Controls, Criteria, and Communication as the "5 C's." This is an informal mnemonic, not a formal standard published by NIST, ISO, or any recognized standards body.
The Major Security Risk Assessment Frameworks and Standards
Four frameworks account for the majority of formal risk assessment programs. Each serves a different organizational profile.
NIST SP 800-30 / Risk Management Framework (RMF). Published by the National Institute of Standards and Technology, SP 800-30 provides a structured process for assessing information security risk. Required for U.S. federal information systems under FISMA. Most comprehensive for organizations needing auditable, government-grade methodology.
ISO/IEC 27005. The international standard for information security risk management. Provides a risk assessment framework aligned with the broader ISO 27001 information security management system. Best for multinational organizations seeking a globally recognized certification path.
FAIR (Factor Analysis of Information Risk). A quantitative risk model that expresses risk in financial terms using loss-exceedance curves. Large financial institutions increasingly require FAIR-based analysis for board reporting. FAIR produces the most precise outputs but requires the most data maturity.
OCTAVE Allegro. Developed by Carnegie Mellon's CERT Coordination Center, OCTAVE Allegro is a self-directed methodology that emphasizes operational resilience without heavy consultant dependency. Best for mid-size organizations building their first formal risk assessment program.
Which Framework Should You Use?
If you need federal compliance: NIST SP 800-30 / RMF (required under FISMA for federal systems)
If you operate across multiple countries: ISO/IEC 27005 (globally recognized, certification pathway)
If your board demands financial risk quantification: FAIR (loss-exceedance curves, dollar-denominated outputs)
If you are building your first program without consultants: OCTAVE Allegro (self-directed, operationally focused)
If you assess physical threats to critical infrastructure: CISA THIRA (mandated for FEMA-funded programs)
If you need adversary behavior modeling for technical threats: MITRE ATT&CK (knowledge base of adversary tactics and techniques)
Qualitative vs. Quantitative vs. Semi-Quantitative Risk Assessment
This section shows how three approaches work in practice using the same scenario.
Scenario: Unauthorized facility access at a corporate campus with 500 employees.
Qualitative Analysis
An assessor evaluates the threat using descriptive scales. Based on recent incidents in the area, local crime trends, and current access control gaps, the assessor rates:
- Likelihood: High (based on three tailgating incidents in the past quarter)
- Impact: Medium (potential for theft and employee safety concern, but no critical infrastructure exposed)
- Risk Level: High-Medium
Quantitative Analysis
The same threat, expressed in financial terms:
- Annual Rate of Occurrence (ARO): 12 (monthly tailgating attempts based on access log data)
- Single Loss Expectancy (SLE): $15,000 (average loss per successful breach)
- Annualized Loss Expectancy (ALE): ARO x SLE = 12 x $15,000 = $180,000
Semi-Quantitative Analysis
The same threat, using a 1 to 5 numeric scale:
- Likelihood: 4 (Likely: occurs several times per year)
- Impact: 3 (Moderate: significant financial or operational disruption, no life safety risk)
- Risk Score: 4 x 3 = 12 (Monitor zone on a 25-point matrix)
Warning: False precision. Quantitative models without good data produce numbers that feel authoritative but are not. Report precision only to the level your data supports.
Physical Security Risk Assessment Methodology
Physical security risk assessment differs from information security risk assessment in three fundamental ways: the threat actor categories are broader (adversarial, environmental, insider), the data collection requires on-site presence, and the threat environment varies at the street level.
The ASIS International General Security Risk Assessment (GSRA) guideline provides the industry standard for physical security assessments.
A comprehensive physical security site audit covers six components:
Perimeter assessment. Evaluate fencing, barriers, bollards, gates, natural surveillance lines, and terrain. Identify blind spots where the perimeter can be breached without detection.
Access control review. Assess entry points, credential systems, visitor management, tailgating prevention, and after-hours access protocols. One Fortune 500 executive residence assessment identified the need for "enhanced perimeter gate access control with additional authentication layers" after threat data revealed specific vulnerability patterns.
Surveillance coverage analysis. Map camera fields of view, identify dead zones, evaluate recording retention and monitoring protocols.
Threat and crime data integration. This is where physical security methodology intersects with geospatial intelligence. A Fortune 500 executive residence assessment team "identified crime clusters within a 0.5-mile radius" including "specific burglary patterns and times, historical crime trends, heatmaps, monthly trends and forecasts" in just 30 minutes, compared to 5 hours using manual research.
Multi-jurisdictional data complexity. Physical security faces a data challenge unique to the domain. As one utility company's security director described: "A single location might have reports filed with city police, state police, transit police, or federal agencies, but threat intelligence platforms typically only pull from the primary local source, missing critical incidents."
Environmental and contextual factors. Time-of-day crime patterns, seasonal variations, proximity to high-risk venues, and local civil unrest history all affect physical security risk calculations. A financial institution conducted "radius-based analyses and hyperlocal threat assessments for all five locations," with their BI team ingesting "change detection and crime type data into internal risk models" to maintain ongoing awareness. That integration enabled standardized BaseScore comparisons and "crime type breakdowns to assess risks relevant to specific property uses."
Physical security assessment is not a one-time audit. Event security teams now use on-demand analytics to produce "data-driven risk assessments of specific venues and surrounding areas" with "detailed crime pattern analysis by location, time, and type" and "visual heatmaps identifying exact crime hotspots."
How to Conduct a Security Risk Assessment: Step-by-Step
This section walks through a concrete scenario: a corporate campus with 500 employees across three buildings, located in a mid-size metropolitan area.
Scenario Setup
The VP of Security has been asked to present a risk assessment to the executive committee. The campus has experienced two vehicle break-ins and one tailgating incident in the past six months. Leadership wants to know whether additional security investment is justified.
Step-by-Step Checklist
- Define scope. Document the three buildings, parking structures, perimeter, commuter routes from public transit, and surrounding 0.5-mile radius. Define time frame: last 12 months of data, forward-looking 12-month risk window. Output: one-page scope statement approved by VP of Security.
- Build asset inventory. Catalogue each building by function (headquarters, R&D, logistics), employee count, critical equipment, and data sensitivity. Rate criticality on a 1 to 5 scale. Include intangible assets: brand reputation, employee morale. Output: asset register spreadsheet with criticality ratings.
- Identify threats. Pull crime data for the 0.5-mile radius: theft, assault, burglary, vandalism, vehicle crime. Review civil unrest indicators. Interview facility managers about recurring issues. Cross-reference with at least two independent data sources. Output: threat catalogue with each threat mapped to affected assets.
- Assess vulnerabilities. Conduct physical site walk of all three buildings. Document: perimeter gaps, lighting dead spots, camera blind zones, access control weaknesses, guard patrol gaps. Review visitor management logs. Output: vulnerability register with photographs and GPS coordinates.
- Score likelihood and impact. Use a 5x5 matrix. Rate each threat-vulnerability pair. Document the rationale for each rating. Output: scored risk register with treatment zone assignments (Accept, Monitor, Mitigate, Escalate).
- Develop treatment plan. For each risk scored Mitigate or Escalate, specify: the control to implement, responsible owner by name, implementation deadline, cost estimate, and expected residual risk score. Output: risk treatment plan with budget summary.
- Document and brief. Compile the risk register, treatment plan, and residual risk documentation into an executive summary. Include trend data showing how risk has changed over time. Output: executive briefing document, full risk register, and treatment tracker.
Risk Scoring: How to Build and Use a Risk Matrix
A risk matrix plots likelihood against impact to produce a risk score that determines treatment priority. The 5x5 matrix below uses scale anchors referenced from NIST SP 800-30 Appendix I assessment scales.
Likelihood Scale Definitions
Impact Scale Definitions
5x5 Risk Matrix
Treatment Zones
A financial institution applied this approach at scale, using "standardized BaseScores for comparing risk levels across different neighborhoods" combined with "trend analysis and crime type breakdowns." The numeric scoring enabled cross-location comparison that subjective ratings never could.
Risk Treatment Strategies: Accept, Mitigate, Transfer, Avoid
Every risk on the register receives one of four treatment decisions.
Accept
Definition: Acknowledge the risk and take no additional action beyond monitoring.
When to use it: The cost of mitigation exceeds the expected loss, or the risk falls within the organization's stated risk appetite.
Critical requirement: Document the acceptance rationale, the authorizing decision-maker, compensating controls (if any), and an expiration date (typically 6 to 12 months).
Mitigate
Definition: Implement controls to reduce likelihood, impact, or both.
When to use it: The risk exceeds acceptable thresholds and cost-effective controls exist.
Physical security example: A Fortune 500 executive residence assessment identified "a cluster of residential burglaries within a half-mile." Treatment: "glass break sensors on upper floors (previously overlooked in original design), enhanced perimeter gate access control with additional authentication layers."
Transfer
Definition: Shift the financial consequence of risk to a third party through insurance, contracts, or outsourcing.
Physical security example: A global 3PL provider developed an "advanced route analysis framework" producing "granular route risk scores and safer alternative directions." The security capability became a "competitive differentiator in customer RFPs," effectively transferring route risk back to the logistics provider who is best positioned to manage it.
Avoid
Definition: Eliminate the risk entirely by removing the asset, activity, or exposure.
Physical security example: A planned event at a venue is cancelled after threat assessment reveals active civil unrest within a two-block radius and no viable security perimeter.
Residual risk is the risk remaining after treatment controls are applied. No mitigation eliminates risk entirely. Risk tolerance is the acceptable level of variation in outcomes that an organization is willing to accept. Risk appetite is the total amount of risk an organization is prepared to pursue or retain. Both must be defined before the assessment begins, not after.
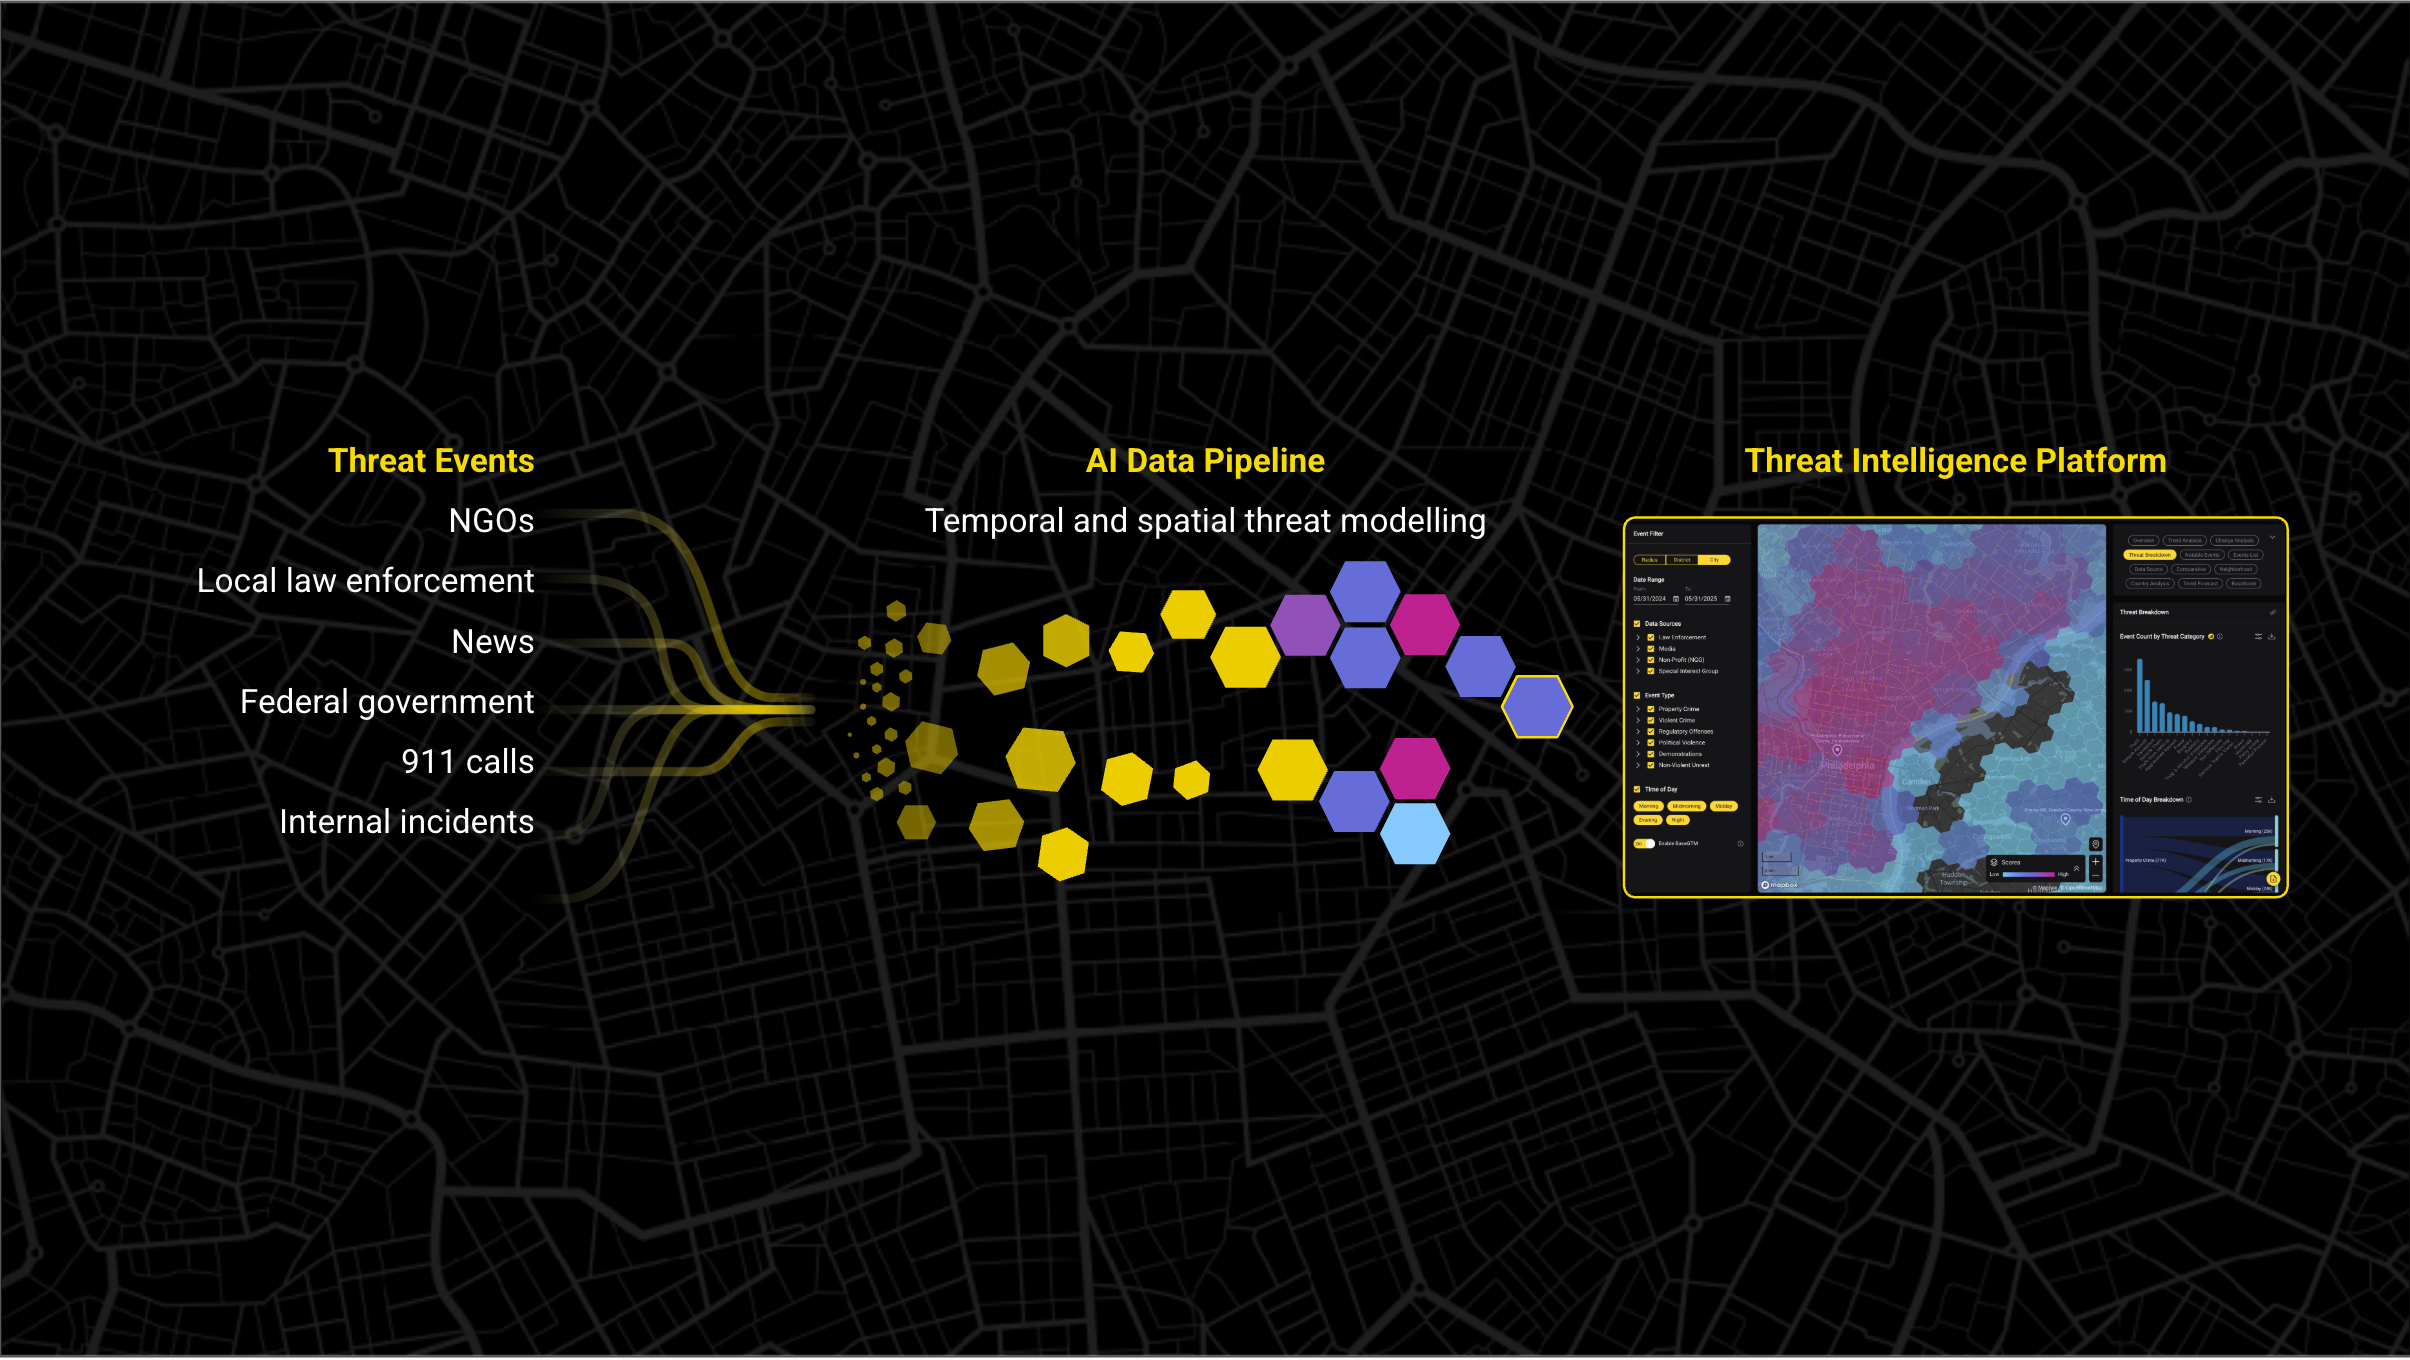
Integrating Threat Intelligence Into Your Risk Assessment
Traditional risk assessments use static checklists: walk the site, fill in the form, score the risks, file the report. The problem is that threat environments change. Static checklists cannot account for this.
Intelligence-driven assessment replaces fixed assumptions with current data. The shift changes the most important variable in the risk equation: likelihood.
How threat intelligence changes likelihood inputs. A Fortune 10 enterprise conducting return-to-office assessments discovered that "detailed crime and unrest data provided precision in measuring risk levels and proximity calculations between transit stops and offices. This accuracy enabled targeted security investments rather than broad, costly measures across all locations."
From point-in-time to dynamic assessment. A Fortune 500 event security team uses on-demand analytics that "enable same-day event location changes when needed" with "proactive identification of emerging risks through ongoing monitoring." Base Operations supports this through monthly BaseScore updates and on-demand analytics across 5,000+ global cities.
Hyperlocal precision. A Fortune 500 executive residence assessment demonstrated why block-level data matters: "The platform's 0.5-mile radius analysis capability revealed what manual research would have missed: a cluster of residential burglaries within a half-mile of the CEO's new residence."
Continuous recalculation. A global 3PL provider uses BaseScore as a "dynamic representation of monthly threat changes across routes. This capability allowed the team to flexibly adjust routes as crime trends shifted over time."
Common Mistakes in Security Risk Assessment Methodology
Six mistakes undermine security risk assessment programs.
1. Treating the assessment as a one-time event. Security teams conduct an assessment, file the report, and do not revisit it until the next audit cycle. Correction: Define reassessment triggers alongside scheduled reviews.
2. Conducting a vulnerability scan and calling it a risk assessment. A vulnerability scan identifies technical weaknesses. A risk assessment evaluates threats, vulnerabilities, likelihood, impact, and treatment. Correction: Require multi-source data collection covering physical, technical, and human threat domains.
3. Using uncalibrated risk scales with no anchor definitions. When "High" has no concrete definition, assessors apply it inconsistently. Correction: Anchor every scale level to specific frequency and financial thresholds.
4. Failing to define risk acceptance criteria before analysis begins. Without pre-defined thresholds, treatment decisions become political rather than methodological. Correction: Establish Accept, Monitor, Mitigate, and Escalate thresholds before the first score is assigned.
5. Ignoring physical and geographic threat vectors. Organizations conducting risk assessments at the country or city level miss block-by-block variation. Correction: Incorporate sub-mile geospatial threat data.
6. Accepting risks indefinitely with no re-evaluation date. Risk acceptance without an expiration date means the risk is forgotten, not managed. Correction: Every risk acceptance entry must include an authorizing signature, a compensating control (if any), and a re-evaluation date no more than 12 months out.
Security Risk Assessment Methodology for Regulated Industries
Healthcare (HIPAA). The HIPAA Security Rule requires a Security Risk Analysis (SRA) that identifies threats and vulnerabilities to electronic protected health information (ePHI), assesses likelihood and impact, and documents current controls. This is the most frequently cited HIPAA audit deficiency.
Financial Services (SOX, PCI DSS, banking regulations). Sarbanes-Oxley requires risk assessment for financial reporting controls. PCI DSS Requirement 12.2 mandates an annual risk assessment process for cardholder data environments.
Federal/Government (NIST RMF, FISMA). Federal information systems must follow the NIST Risk Management Framework, with SP 800-30 providing the risk assessment methodology. FISMA compliance is mandatory, not voluntary.
Critical Infrastructure (CISA THIRA). The Threat and Hazard Identification and Risk Assessment process is mandated for organizations receiving FEMA preparedness grants.
Tools and Software That Support Risk Assessment Methodology
Tools enable methodology. They do not replace it.
GRC Platforms. RSA Archer, ServiceNow IRM, and LogicGate Risk Cloud provide risk register management, workflow automation, and compliance tracking.
Quantitative Risk Analysis. RiskLens is the primary platform implementing the FAIR framework, producing loss-exceedance curves and financial risk quantification.
Vulnerability Data Inputs. Tenable.sc and Rapid7 InsightVM provide technical vulnerability data that feeds into the threat identification and vulnerability analysis steps.
Physical Security Threat Intelligence. Base Operations provides the geospatial threat data layer that informs likelihood inputs for physical security risk assessments. With 25,000+ global data sources, sub-mile granularity across 5,000+ cities, and monthly risk score updates via BaseScore, the platform fills the intelligence gap that checklist-based assessments leave open. A Fortune 500 event security team used the platform for "dynamic location tracking, automated risk scoring, and 0.3-mile radius precision threat analysis." A financial institution integrated the API to "ingest crime data and change detection metrics, incorporate street-level intelligence into existing risk models, and create standardized scoring mechanisms."
Third-Party and Vendor Risk. SecurityScorecard and UpGuard assess the risk posture of vendors and partners.
FAQ: Security Risk Assessment Methodology
What is the difference between a security risk assessment and a threat assessment?
A security risk assessment evaluates the full risk equation: threats, vulnerabilities, and consequences. It produces a prioritized risk register and treatment plan. A threat assessment focuses narrowly on identifying and characterizing threat sources and threat events without analyzing organizational vulnerabilities or calculating risk scores. Think of threat assessment as one input to the broader risk assessment process. It answers "what could happen." Risk assessment answers "how likely is it, how bad would it be, and what should we do about it." Many organizations conduct threat assessments as Step 3 of the seven-step risk assessment process described above, feeding threat data into the vulnerability analysis and scoring steps.
What are the 5 C's of risk assessment?
The 5 C's of risk assessment (Context, Consequences, Controls, Criteria, Communication) are an informal mnemonic used in some practitioner training materials. They are not a formal standard published by NIST, ISO, or any recognized standards body. Context refers to understanding the operating environment. Consequences covers impact severity. Controls addresses existing safeguards. Criteria defines risk acceptance thresholds. Communication ensures findings reach decision-makers. As a memory aid, the 5 C's are useful. As a methodology, they are incomplete. Practitioners should anchor their programs to NIST SP 800-30, ISO 27005, or FAIR rather than treating an informal mnemonic as a framework.
What is the difference between qualitative and quantitative risk assessment?
Qualitative risk assessment uses descriptive scales (High, Medium, Low) and expert judgment. It is faster, requires less data, and works well for initial assessments. Quantitative risk assessment uses mathematical formulas like Annualized Loss Expectancy (ALE = ARO x SLE) to express risk in dollar values. It provides financial precision but requires three to five years of mature data. The middle ground is semi-quantitative assessment, which assigns numeric scales (1 to 5) that bridge judgment with comparability. Most organizations start qualitative, add semi-quantitative scoring as they build data, and layer in quantitative analysis for high-value decisions that require board-level financial justification.
How often should a security risk assessment be conducted?
Conduct formal assessments at minimum annually, with quarterly reviews for high-risk locations and immediate reassessment after significant changes. Significant changes include new facility openings, major security incidents, organizational restructuring, regulatory updates, and material shifts in the local threat landscape. One global 3PL conducts quarterly risk assessments across 400+ supply chain routes using automated threat intelligence. The goal is continuous methodology: scheduled comprehensive reviews supplemented by trigger-based reassessment when conditions change.
What does a security risk assessment methodology template include?
A complete template includes nine elements: (1) scope definition with assessment boundaries and objectives, (2) asset inventory with criticality ratings, (3) threat source identification checklist covering adversarial, environmental, and accidental threats, (4) vulnerability assessment worksheet, (5) likelihood and impact rating scales with concrete anchor definitions, (6) a 5x5 risk scoring matrix with treatment zone thresholds, (7) risk register with columns for asset, threat, vulnerability, likelihood, impact, risk score, treatment decision, owner, and deadline, (8) risk treatment plan with acceptance rationale and re-evaluation dates, and (9) executive summary format for leadership briefing.
How do you calculate a risk score in a security risk assessment?
In a semi-quantitative approach, plot Likelihood (1 to 5) against Impact (1 to 5) on a risk matrix to produce a score from 1 to 25. Categorize scores into treatment zones: Accept (1 to 6), Monitor (7 to 12), Mitigate (13 to 19), Escalate (20 to 25). For quantitative calculation, use Annualized Loss Expectancy: ALE = ARO (Annual Rate of Occurrence) x SLE (Single Loss Expectancy). If unauthorized facility access occurs twice per year (ARO = 2) with $50,000 average loss per incident (SLE), the ALE is $100,000. The financial figure enables direct comparison across different risk types and supports budget justification to non-security executives.
What is residual risk and how is it managed?
Residual risk is the risk remaining after treatment controls are applied. No mitigation eliminates risk entirely. Management requires four steps: (1) calculate the post-treatment risk score using the same matrix applied to inherent risk, (2) document the acceptance rationale and any compensating controls, (3) assign an authorized decision-maker to formally accept the residual risk, and (4) set a re-evaluation date, typically 6 to 12 months out. Accepting residual risk indefinitely without documented re-evaluation is one of the most common audit failures.
How does physical security risk assessment differ from cybersecurity risk assessment?
Physical security risk assessment addresses tangible threats: adversarial actors, environmental hazards, insider threats, and civil unrest. It requires on-site data collection (perimeter walks, access control audits, surveillance reviews) and integration of local crime and geopolitical intelligence. Cybersecurity risk assessment focuses on digital attack surfaces, network vulnerabilities, and data protection. Physical assessments must account for geographic variability, since threat levels differ block by block, and multi-jurisdictional data complexity, since a single location may have reports from city, state, transit, and federal agencies.
Takeaways

Join 1100+ security leaders getting new ideas on how to better protect their people and assets.