Physical Threat Assessment Platform: How Enterprise Security Teams Evaluate and Mitigate Real-World Risk
A physical threat assessment platform continuously collects, analyzes, and scores real-world threat data to help organizations protect their people, assets, and facilities. This guide covers the five core capability categories, how to evaluate enterprise solutions, pricing models, and framework alignment for platforms that aggregate intelligence from thousands of sources and deliver prioritized risk insights.

Physical Threat Assessment Platform: How Enterprise Security Teams Evaluate and Mitigate Real-World Risk
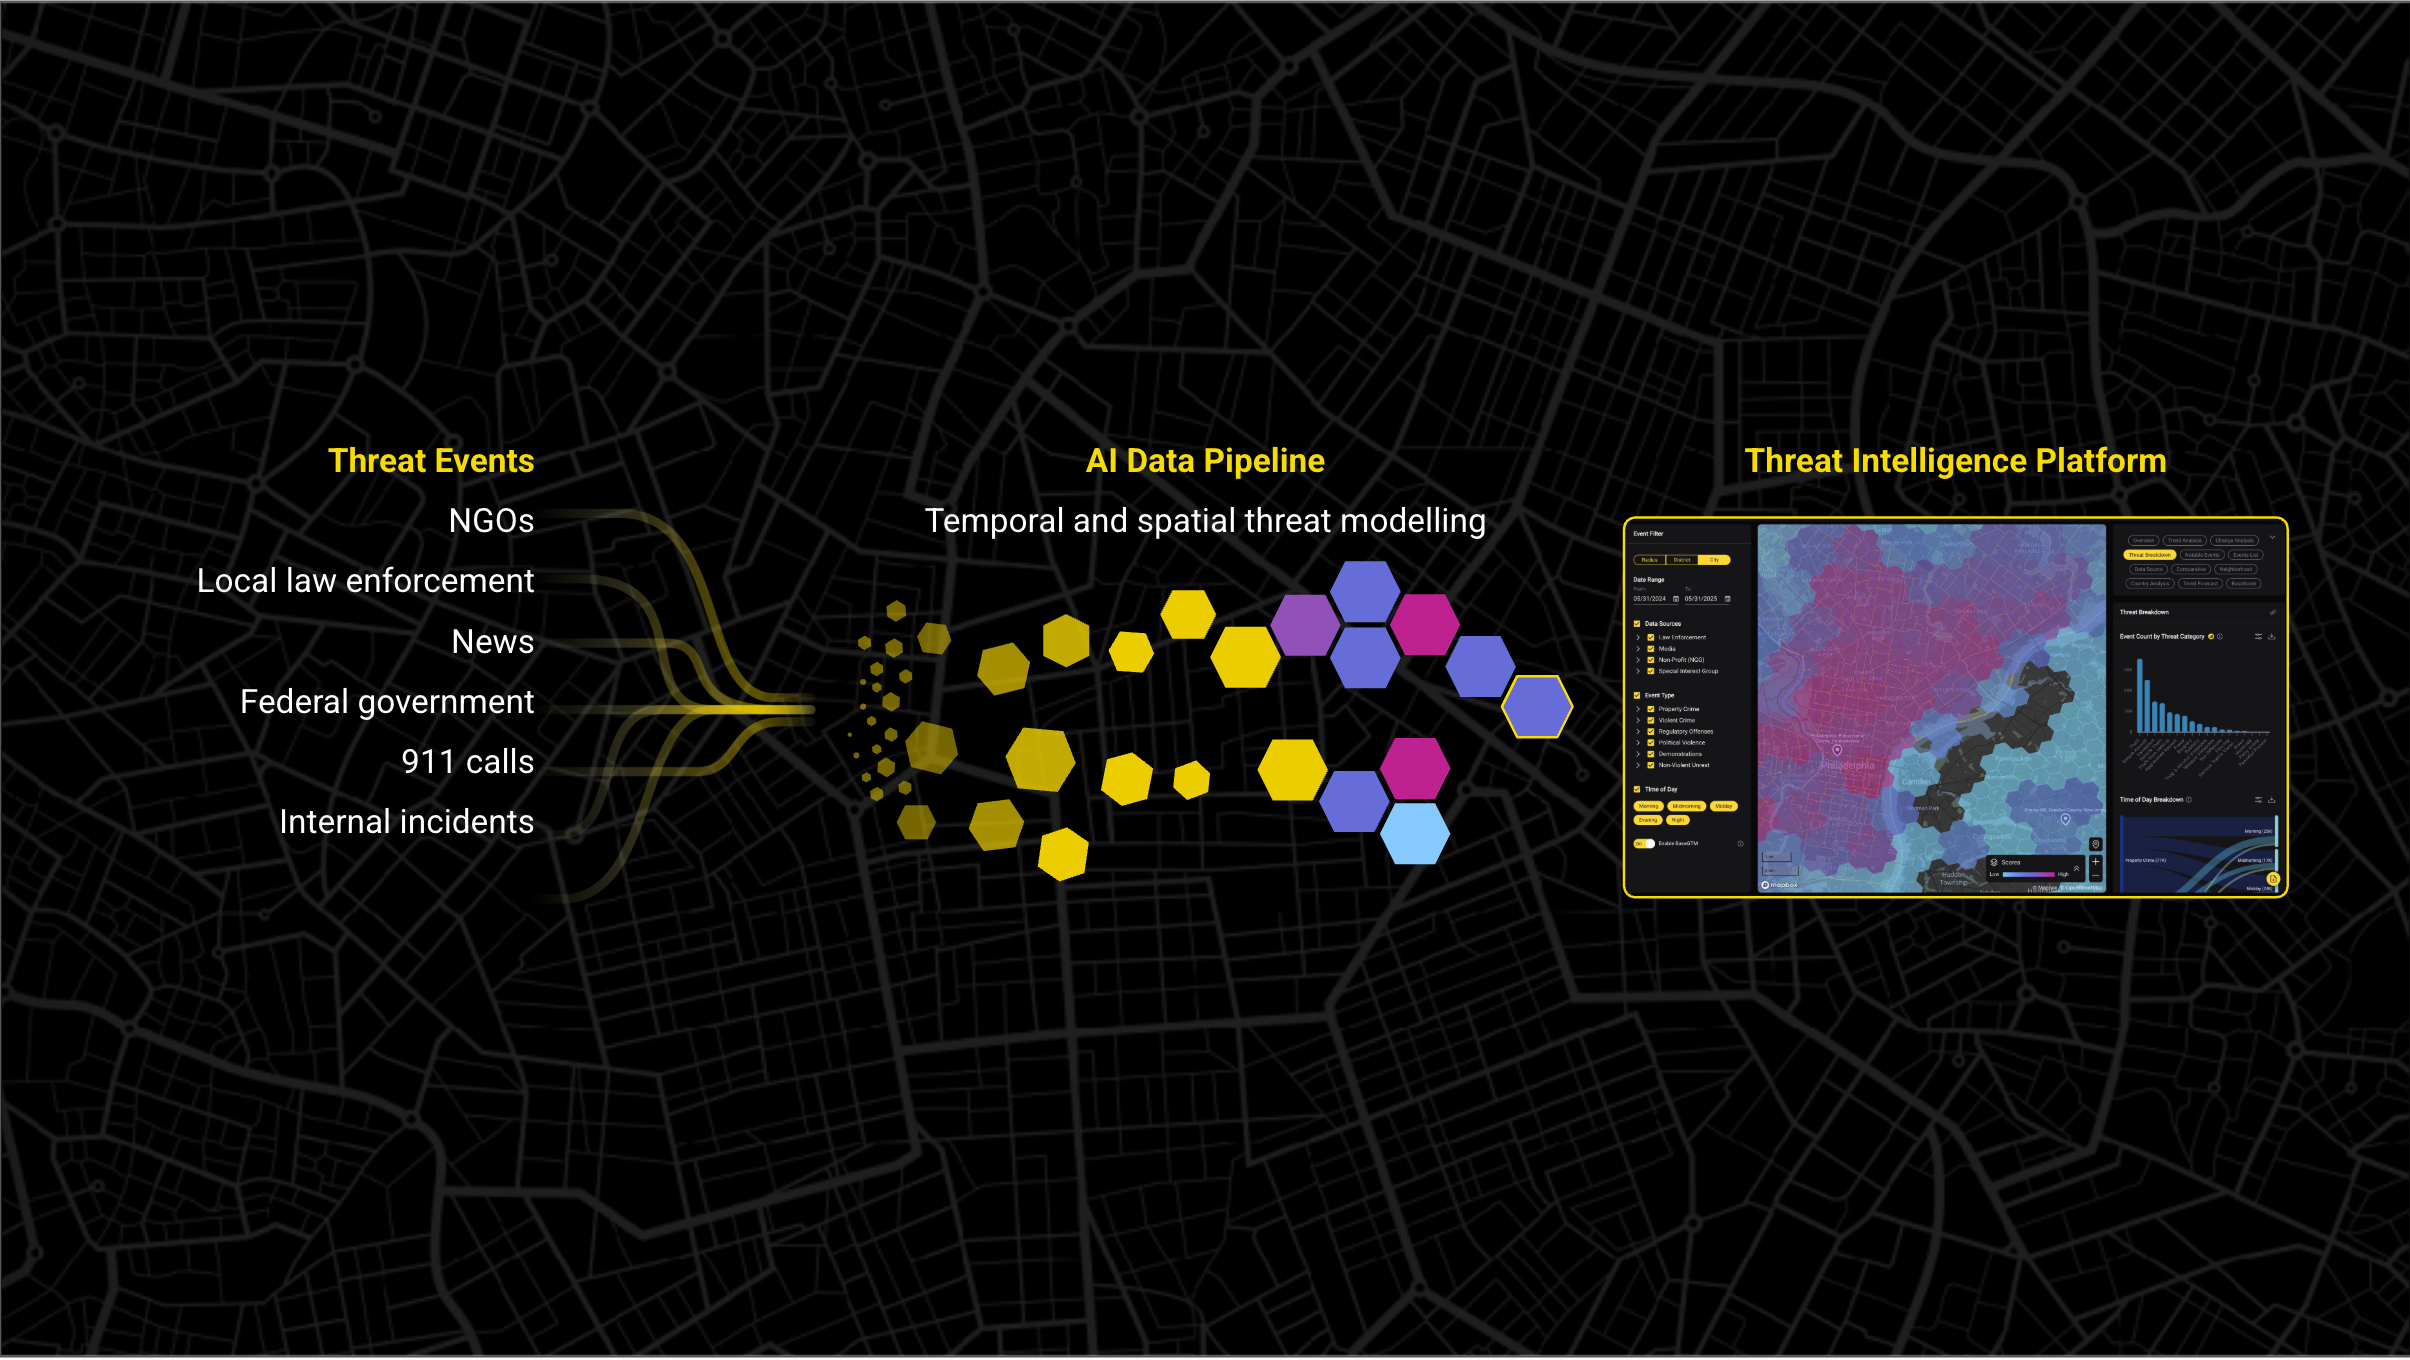
A physical threat assessment platform is software that continuously collects, analyzes, and scores real-world threat data to help organizations protect their people, assets, and facilities. Unlike cybersecurity tools that focus on digital network threats, or static checklist-based assessments conducted once a year, these platforms aggregate intelligence from thousands of sources, apply AI-driven scoring, and deliver prioritized risk insights across an organization's entire physical footprint. The three core functions of a physical threat assessment platform are: assessing the likelihood and severity of threats, prioritizing mitigations based on quantified risk, and enabling coordinated response across people, facilities, events, and supply chains.
Physical Threat Assessment Platform (definition): A category of security software that continuously aggregates multi-source threat intelligence, applies AI-driven risk scoring, and delivers prioritized physical security insights to protect people, facilities, events, and supply chains. Recognized assessment frameworks include ASIS International's Physical Asset Protection (PAP) standard and FEMA 452, which provide the underlying methodology these platforms operationalize at scale.
The operational challenge these platforms address is one of fragmented intelligence. As one associate director for physical security at a major defense and aerospace company described it: "We're branching out to multiple functional core areas to gather that collective data. We have CI and I that can provide the threat analysis. We deal with our government customers, local law enforcement... All that data gets put into an overall product." The platform consolidation problem is equally pressing in energy and utilities. A personnel security manager at a major North American energy company noted the advantage of having "one place instead of NYPD crime data, Toronto police crime data" rather than trying to "mesh the two together or create a realistic picture over multiple reports for different trips."
The Core Problem These Platforms Solve
Manual intelligence workflows create three failure modes that compound at enterprise scale: siloed data across jurisdictions and vendors, slow detection and assessment cycles, and no connection between raw intelligence and operational response.
The scale of the problem is quantifiable. At one Fortune 500 CRM provider, "each location required 2-3 days of analyst time. A single event across 4-5 key locations consumed 10-15 days of security team capacity, before the event even began." A Fortune 10 company undertaking return-to-office planning faced "assessment cycles taking weeks that couldn't handle 500+ locations, inconsistent threat analysis across different cities, and no single view of risk patterns across all offices."
The data quality problem is just as acute. A security analyst at a major healthcare organization described the reality of working with public data: "I have to go through, like, the LAPD's giant JSON file, and there's just a lot of reporting coming in from different places that gets pulled into that. So there's never really a way to know if these are conflated numbers or what that looks like." When a single analyst at a North American energy company is "doing the job of 10 people," the gap between intelligence need and capacity becomes untenable.
Who Uses a Physical Threat Assessment Platform?
Physical threat assessment platforms serve multiple roles within and beyond the security organization:
- Chief Security Officers (CSOs): Set enterprise security strategy and need portfolio-wide risk visibility to justify budget and influence executive decisions.
- Global Security Operations Center (GSOC) analysts: Monitor threats across global footprints and triage intelligence for operational response.
- Executive protection teams: Assess threat environments around executive residences, travel routes, and events. One Fortune 500 travel company's risk intelligence team manages EP, employee travel security for 15,000+ staff, and risk intelligence without additional headcount.
- Asset protection teams: Manage physical security across large retail or distributed footprints. One pharmacy retail company's asset protection team manages executive protection across 9,000+ retail locations and 255,000 employees.
- Event security managers: Evaluate venue risk for corporate events. One healthcare nonprofit manages 3,000+ events annually using a tier-based triage system informed by threat data.
- Travel security managers: Provide data-driven safety assessments for employee travel in volatile environments.
- Facility security managers: Conduct site assessments for new and existing locations, often supporting real estate and operations decisions.
The Five Core Capability Categories of a Physical Threat Assessment Platform
The physical threat assessment market spans five distinct capability categories. Understanding these categories helps buyers identify which platforms match their primary use cases and where they may need multiple solutions to cover their full operational requirements.
1. External Threat Intelligence and OSINT Collection
External threat intelligence and OSINT collection refers to the automated aggregation and analysis of open-source intelligence (OSINT), which includes publicly available data from social media, news outlets, law enforcement records, and other open sources. This category spans two distinct modes. Event-driven alerting platforms like Dataminr and Flashpoint/Echosec push notifications within minutes of a detected event, with Dataminr's approximately 45-minute first-alert lead time serving as an industry benchmark. Persistent threat landscape intelligence platforms like Base Operations aggregate and score ongoing risk patterns with monthly updates and on-demand analytics. These are complementary capabilities, not interchangeable. One Fortune 500 CRM provider reduced venue security comparison time from 4-6 hours to under 30 minutes using on-demand analytics, while a North American energy company consolidated cross-jurisdictional data into a single platform rather than manually merging reports from multiple police departments.
2. Facility and Site Vulnerability Scoring
Facility and site vulnerability scoring refers to the digitized assessment of physical security risks at specific locations, replacing static annual reviews with dynamic, data-driven scoring. Frameworks like FEMA 452 (a risk assessment methodology for buildings and infrastructure developed by the Federal Emergency Management Agency) and the ASIS Physical Asset Protection (PAP) standard provide the underlying assessment methodology. Modern platforms integrate crime data from providers like CapIndex and GeoSure with geofencing capabilities (the ability to define virtual geographic boundaries around a specific location for monitoring purposes) to produce risk scores that update as conditions change. One financial institution achieved 5x faster site assessment delivery using standardized BaseScore™ values to compare risk levels across different neighborhoods with trend analysis showing how crime patterns were evolving. A Fortune 10 company unified 500+ locations into a single threat assessment dashboard, reducing assessment cycles from weeks to hours. As one director of market strategy at a major discount retailer noted: "There's probably some filtering of, like, we don't wanna put a store here at all because the violence is too high."
3. Behavioral Threat Assessment and Case Management
Behavioral threat assessment (BTA) refers to the systematic evaluation of individuals who may pose a risk of targeted violence, using structured rubrics and multi-disciplinary team (MDT) workflows. MDTs bring together security, HR, legal, and mental health professionals to evaluate threat indicators. The WAVR-21 (Workplace Assessment of Violence Risk, a 21-item structured professional judgment instrument) and ATAP (Association of Threat Assessment Professionals) standards provide validated assessment frameworks. This capability is critical for workplace violence prevention and executive protection. Specialized platforms like Ontic, Navigate360, and Resolver focus on person-of-interest watchlists, legal-grade documentation, and case management workflows. Some platforms excel at geospatial intelligence while others specialize in behavioral case management. Buyers should evaluate based on their primary use case.
4. Critical Event Management and Response Automation
Critical event management (CEM) refers to the technology and processes that connect threat intelligence to coordinated organizational response during and after security events. CEM platforms provide mass notification, travel-risk routing, incident command dashboards, and integration with access control and guard dispatch systems. Everbridge and OnSolve are established players in this category. The distinction between CEM and threat assessment is temporal: threat assessment platforms focus on understanding persistent risk, while CEM platforms focus on response execution during active events. One Fortune 500 CRM provider completed event security briefings 72 hours faster than the previous process by connecting threat intelligence to operational planning. A Fortune 500 travel company evolved travel briefs from "high-level city summaries to in-depth, location-specific security recommendations aligned with executive preferences."
5. Risk Analytics and ROI Reporting
Risk analytics and ROI reporting refers to the dashboard and reporting capabilities that quantify security program outcomes and align them to business objectives. ISO 31000 (the international standard for risk management providing principles and guidelines for managing risk) provides the most widely referenced framework for enterprise risk reporting. This capability is what security leaders need to justify budget and demonstrate strategic value. The director of security at a major financial institution "successfully elevated the security function from a cost center to a strategic advantage by providing data-driven insights that directly supported business objectives." A personnel security manager at a North American energy company valued "the ability to actually show source material, methodology, that kind of stuff that you can do on the platform instead of it being kind of this black box." As one event security leader at a healthcare nonprofit put it: "If you didn't see it on the news, it didn't happen... having charts, graphs, statistics, all the things like, here's exhibit A."
Physical Threat Assessment Platform vs. Adjacent Categories: What's the Difference?
Many buyers confuse physical threat assessment platforms with adjacent technology categories. The overlap is real, but the distinctions matter for procurement decisions. As one associate director for physical security at a major defense and aerospace company put it, describing the evaluation process: "We get a lot of those. I'll call them end of line products that are spit out already ready to go for us."
Physical Security Information Management (PSIM) refers to systems that unify hardware management across cameras, access control, and alarm systems. This is a different layer of the security stack entirely.
The following comparison clarifies where each category fits:
The practical implication: most enterprise security programs need capabilities from multiple categories. A physical threat assessment platform provides the persistent intelligence layer that informs decisions across the other categories.
How Physical Threat Assessment Platforms Work: The Intelligence-to-Action Lifecycle
Physical threat assessment platforms follow a five-step intelligence lifecycle, from raw data collection to documented response. Each step adds analytical value to the raw inputs.
Step 1: Collect: Aggregating Multi-Source Threat Data
The collection phase ingests data from law enforcement agencies, government feeds, news sources, social media, and open datasets across jurisdictions. The challenge is jurisdictional complexity. As one security professional at a major utility company described: "Let's say this is a normal NYPD service area, but... you have Amtrak police there. Sometimes there could be state police, MTA police." Another team at a global travel company noted: "Our team does it directly, and we compile from other sources like MAX and Sublime primarily." Platforms automate this multi-source aggregation to eliminate manual compilation.
Step 2: Normalize and Enrich: Adding Context and Geospatial Relevance
Raw data from different jurisdictions uses inconsistent classifications, date formats, and geographic references. Normalization standardizes this data into comparable formats. As one analyst at a major healthcare organization explained: "There's never really a way to know if these are conflated numbers or what that looks like." Enrichment adds geospatial context, mapping incidents to precise coordinates. One financial institution's BI team used the Base Operations API to ingest crime data and change detection metrics, incorporating street-level intelligence into existing risk models.
Step 3: Classify: AI Scoring and Risk Prioritization
Classification applies AI scoring models to normalized data, producing risk scores calibrated to specific use cases. Different business decisions require different risk thresholds. As one director at a major discount retailer described: "We don't wanna put a store here at all because the violence is too high. It's too risky... then there's another layer below that where safe enough to have a store, but we do need to know there's gonna be high shrink." One financial institution uses standardized BaseScore values for comparing risk levels across different neighborhoods, enabling portfolio-wide prioritization.
Step 4: Deliver: Surfacing Actionable Intelligence to the Right Team
Delivery means putting scored, contextualized intelligence into the hands of analysts, managers, and executives through dashboards, reports, and API integrations. For Base Operations, this means on-demand analytics and API access, not push notifications. One Fortune 500 CRM provider uses on-demand risk analytics to enable "same-day event location changes when needed." In an executive residence assessment, a security team "within 30 minutes identified crime clusters within a 0.5-mile radius and shared actionable intelligence with security integrators."
Step 5: Respond and Document: Closing the Loop
The final step connects intelligence to action and creates an audit trail. In one Fortune 500 executive residence assessment, threat intelligence "directly informed critical security adjustments: glass break sensors on upper floors (previously overlooked in original design), enhanced perimeter gate access control with additional authentication layers." A Fortune 500 travel company's approach evolved: "Travel briefs evolved from reactive city summaries to proactive, location-specific intelligence products." Documentation ensures that both the intelligence and the resulting decisions are recorded for compliance and continuous improvement.
Key Evaluation Criteria When Choosing a Physical Threat Assessment Platform
Selecting a physical threat assessment platform requires evaluating capabilities against your operational requirements. The following criteria form a practical scoring framework for vendor evaluation.
Intelligence Delivery Speed and Analytics Responsiveness
Two distinct speed dimensions matter for physical threat assessment. Event-driven alert latency measures how quickly a platform like Dataminr notifies analysts of breaking events (approximately 45-minute benchmark). On-demand analytics speed measures how quickly a persistent intelligence platform delivers threat assessments on request. These serve different operational needs. One Fortune 500 company reduced executive residence threat assessments from 5 hours to 30 minutes, a 90% improvement in on-demand analytics speed. Another reduced venue security comparisons from 4-6 hours to under 30 minutes. Neither metric relates to push alerts.
Ask the vendor: "For event-driven alerting: What is your average time from event detection to analyst notification? For persistent intelligence: How frequently is risk scoring updated, and what is your on-demand analysis turnaround time?"
Geospatial Intelligence and Asset Proximity Mapping
The ability to define custom geographic boundaries around facilities, events, or executive residences determines how precisely a platform can assess location-specific risk. Base Operations BaseScore operates at sub-mile granularity using H3 hex-level cells. In one executive residence assessment, a 0.5-mile radius analysis "revealed a cluster of residential burglaries within a half-mile of the CEO's new residence." Another team uses 0.3-mile radius analysis around event venues for comprehensive coverage. As one GIS director at a major retailer noted: "We never know exactly how far we have to go when we're kinda making some assumptions when we start to drop points."
Ask the vendor: "At what geographic resolution does your platform operate, and can you define custom radius-based boundaries around specific assets?"
Data Source Coverage and Collection Depth
The breadth and depth of data sources directly impacts assessment quality. One security professional at a major utility described the complexity: "You have Amtrak police there. Sometimes there could be state police, MTA police." Another team at a global travel company noted the difficulty of scraping non-traditional sources like community apps, calling those sources "extremely challenging." Platforms like Flashpoint/Echosec and Babel Street specialize in different source categories. A Fortune 500 travel company validated that "assessments maintained the same quality standards whether evaluating a major metropolitan hub or a secondary market."
Ask the vendor: "How many unique data sources do you ingest, and what is your coverage across non-English languages and rural/developing regions?"
Integration With Existing Security Stack
A physical threat assessment platform must connect to your existing security infrastructure: PSIM systems, HRIS platforms, access control, ITSM, mass notification, SIEM/SOAR, and GIS tools. One financial institution's BI team used the Base Operations API to "ingest crime data and change detection metrics" and "incorporate street-level intelligence into existing risk models." A GIS director at a major retailer described interest in "bringing that in as a feature service or map service within our existing map application environment." Standalone tools that cannot integrate create data silos and duplicate analyst effort.
Ask the vendor: "Does your platform offer a documented REST API, and what are the available data export formats for integration with PSIM, SIEM, and GIS platforms?"
Compliance and Framework Alignment
Enterprise buyers should evaluate alignment to FEMA 452, ASIS PAP standard, ISO 31000, ATAP behavioral standards, and SAFETY Act Designation. GDPR and privacy compliance are increasingly relevant, particularly for organizations with European operations or union environments where surveillance considerations apply. This is a gap across the competitive landscape: every major vendor references specific standards, but comprehensive cross-framework mapping is rare. Buyers should verify which frameworks a platform explicitly supports and whether it provides compliance-ready reporting templates.
Ask the vendor: "Which compliance frameworks does your platform explicitly align to, and do you provide compliance-ready reporting templates for FEMA 452, ASIS PAP, or ISO 31000 audits?"
Scalability and Pricing Model
Enterprise SaaS platform licensing typically ranges from $40K to $350K per year depending on scope and tier. Mid-market solutions fall in the $40K to $120K range. Site-based licensing runs $1,500 to $3,000 per facility per year. As one procurement lead at a major discount retailer noted: "We run around 4,000 points a year... If there's going to be a per transaction charge versus a flat fee." A Fortune 500 travel company documented $25,000 in annual savings while expanding both scope and quality of their intelligence program. Cost justification typically anchors on incident avoidance and analyst time savings.
Ask the vendor: "What is your pricing model, per seat, per location, or platform license, and what additional costs should we budget for implementation and training?"
Physical Threat Assessment Platform Template: What a Structured Assessment Looks Like
One of the most common questions security teams ask is what a platform-generated threat assessment should actually contain. The answer draws from established frameworks like FEMA 452, the ASIS PAP standard, and CPTED (Crime Prevention Through Environmental Design) principles, operationalized through data-driven scoring.
Core Assessment Domains
A comprehensive physical threat assessment covers five domains:
- Perimeter and access control: Evaluation of physical barriers, entry points, surveillance coverage, and access management systems.
- Threat environment: External crime data, geopolitical factors, civil unrest indicators, and historical incident patterns specific to the location's immediate surroundings.
- Personnel and insider risk indicators: Assessment of internal threat factors including workplace violence indicators, employee behavioral concerns, and HR-flagged issues.
- Critical asset identification: Mapping of high-value assets, key personnel, critical infrastructure, and business-continuity dependencies at the site.
- Response and continuity capabilities: Evaluation of emergency response procedures, communication systems, evacuation plans, and business continuity measures.
A major financial institution uses Base Operations to standardize these assessments across 247 offices, while a pharmacy retail company achieved consistent data coverage for standardized threat assessments across 73 evaluated locations.
Scoring Methodology: Likelihood vs. Impact
Platforms combine two scoring dimensions into a single prioritized risk score. Likelihood measures the probability that a specific threat will materialize, drawing on historical incident data, trend analysis, and environmental indicators. Impact measures the potential consequence to people, operations, and assets. FEMA 452's vulnerability-threat-consequence model provides the foundational framework: risk equals the function of threat, vulnerability, and consequence. A standardized scoring system (such as a 0-100 scale) enables direct comparison across locations with different threat profiles and operational contexts.
What a Platform-Generated Risk Report Should Contain
A complete platform-generated risk report includes:
- Executive summary: Top-line risk score, key findings, and priority recommendations.
- Threat environment overview: Crime type breakdowns, trend analysis, and comparison to benchmarks.
- Vulnerability assessment: Gap analysis of physical controls against identified threats.
- Risk score with methodology: Transparent scoring methodology showing how the score was calculated.
- Recommended mitigations: Prioritized actions tied to specific vulnerabilities.
- Trend analysis: Historical data showing risk trajectory over time.
- Appendix with source data: Attribution of intelligence sources for credibility and audit compliance.
Free vs. Paid Physical Threat Assessment Platforms: What You Actually Get
Free physical threat assessment tools exist, and they serve a purpose. Providers like RiskWatch (free trial tier), EasySet (template-based assessment), and North Star Group (CPTED evaluation tool) offer entry-level assessment structure: checklists, basic scoring rubrics, and report templates. Public data sources like FBI UCR, local police department crime maps, and FEMA risk assessment guides are also freely available.
The limitations emerge at scale. Free tools require manual data collection, produce point-in-time snapshots that are outdated the moment they are generated, and cannot normalize data across jurisdictions. A Fortune 10 company experienced this firsthand: "Assessment cycles taking weeks that couldn't handle 500+ locations." A security analyst at a major healthcare organization described the manual reality of free data: "I have to go through, like, the LAPD's giant JSON file." That public data exists, but extracting intelligence from it requires significant analyst time.
The threshold for needing a paid platform is typically 10+ locations, a requirement for ongoing risk scoring rather than one-time assessments, or a mandate to compare risk across jurisdictions using standardized methodology. One pharmacy retail company documented 37 hours saved every 45 days after transitioning from manual processes to a platform approach, covering 73 locations during that evaluation period.
Best Physical Threat Assessment Platforms: How to Compare Enterprise Solutions
Rather than ranking platforms against each other, the most productive approach is matching platform capabilities to your primary use case. Different tools excel in different operational contexts. The following table maps common enterprise use cases to the capability focus and platform options best suited to address them.
Proof points from enterprise deployments illustrate how platform choice connects to outcomes. A Fortune 500 CRM provider used GSOC-focused intelligence to cover 3x more locations with the same headcount. A major financial institution achieved 5x faster site assessment delivery through multi-site scoring. A Fortune 500 travel company assessed 300+ locations annually at sub-mile precision for executive protection.
Flashpoint Physical Security Intelligence: What It Offers and How It Compares
Flashpoint Physical Security Intelligence (formerly Echosec) provides geospatial OSINT capabilities including social media monitoring across 100+ languages, AI-generated event summaries, author insights for source credibility assessment, and location-based threat detection. The platform focuses on identifying emerging threats from open-source data and is particularly strong in social media intelligence and dark web monitoring.
Base Operations takes a different approach. Rather than social media OSINT, Base Operations focuses on street-level crime data aggregation at sub-mile resolution across 25,000+ sources and 5,000+ global cities. The platform provides a quantified risk scoring system (BaseScore) that produces a 0-100 score for any location, enabling direct comparison across locations. Core differentiators include crime data normalization across jurisdictions, facility-specific vulnerability scoring, API-first integration for custom risk models, and monthly scoring updates that track threat trajectory over time.
These platforms address different intelligence needs and are frequently deployed together. Flashpoint covers the event-driven OSINT layer, identifying emerging threats from social media and open sources. Base Operations covers the persistent crime and risk intelligence layer, providing standardized scoring and trend analysis. Buyers whose primary need is social media threat detection will find Flashpoint more directly applicable. Buyers whose primary need is site-level risk scoring, portfolio comparison, and crime trend analysis will find Base Operations more directly applicable.
Physical Security Assessment Templates and Frameworks: ASIS, FEMA, and Beyond
Several established frameworks provide the foundation for physical security assessments. Understanding which frameworks apply to your organization determines which platform capabilities matter most.
ASIS International Physical Asset Protection (PAP) Standard is the most widely referenced industry standard for physical security assessments. It provides a structured methodology for identifying assets, assessing threats and vulnerabilities, and recommending countermeasures. ASIS also publishes guidelines for workplace violence prevention programs.
FEMA 452 is a risk assessment methodology developed for buildings and critical infrastructure. It uses a vulnerability-threat-consequence model that many platforms have operationalized into automated scoring engines.
CPTED (Crime Prevention Through Environmental Design) focuses on how the physical design and layout of the built environment can reduce crime and improve safety. CPTED audits are often conducted alongside threat assessments for new site selection.
ISO 31000 provides international guidelines for enterprise risk management. For security teams, ISO 31000 alignment means risk scoring methodologies follow recognized principles, and reports meet board-level governance standards.
NIST SP 800-53 is primarily a cybersecurity framework, but its physical and environmental protection controls (PE family) are increasingly referenced for converged cyber-physical security programs.
NATF CIP 014 applies specifically to the electric utility sector, providing physical security standards for critical transmission stations and substations. Platforms like RiskWatch have built compliance reporting aligned to this standard.
The gap between templates and platforms is operational. Templates provide the assessment structure; platforms provide the continuous data, automated scoring, and scalability to execute that structure across hundreds of locations. One financial institution operationalized standardized scoring across 247 offices, turning a framework into a repeatable, data-driven workflow.
Physical Security Assessment Cost: What Organizations Budget and Why
Physical security assessment costs vary based on three distinct procurement models:
Cost drivers include geographic coverage requirements, number of locations monitored, integration complexity, and user seat count. Volume matters: one procurement lead at a major discount retailer raised the key question: "We run around 4,000 points a year... If there's going to be a per transaction charge versus a flat fee."
ROI justification typically anchors on four categories: incident cost avoidance (the most defensible), analyst labor reduction (documented at 70%+ time savings by multiple organizations), insurance premium negotiation (quantified risk data strengthens insurer discussions), and liability limitation (documented due diligence protects against negligence claims).
A Fortune 500 travel company documented $25,000 in annual savings while expanding both the scope and quality of their intelligence program. A pharmacy retail company saved 37 hours every 45 days, which, at loaded analyst costs of $75-$100 per hour, represents approximately $55,000-$74,000 in annualized savings.
As one security leader at a major utility company noted about the budget process: "There's budget meetings too that we are in the midst of... we gotta work through what my bucket of money is gonna be." The security teams that win budget are the ones who present quantified cost-avoidance data alongside the spend request.
How Base Operations Approaches Physical Threat Assessment
Base Operations takes a specific approach to physical threat assessment built on three pillars: data breadth, geospatial precision, and assessment speed.
The data layer. Base Operations aggregates intelligence from 25,000+ global sources including local police departments, national law enforcement agencies, government feeds, news outlets, and open datasets. This data covers 5,000+ global cities with 99% US coverage and tracks 150+ million mapped incidents across 13 crime subcategories and 3 unrest subcategories. Crime data updates monthly (bi-weekly in many areas), and unrest data updates bi-weekly.
The geospatial intelligence approach. BaseScore is a 0-100 risk scoring system that operates at H3 hex-level cells (approximately 1-mile radius) with analysis available down to 0.1-mile radius. This sub-mile granularity enables direct comparison across locations with different threat profiles. The scoring is weighted (violent crimes weighted higher than property crimes, homicides weighted higher than fraud), population-density normalized, and transparent in methodology.
The assessment workflow. BaseEngine, the platform's proprietary AI modeling system, transforms noisy and sparse data into consistent trendlines, learns seasonal patterns for forward-looking forecasts, and redistributes city-level data across geographic cells using machine learning. This means the platform produces reliable assessments even in data-sparse regions where competitors lack coverage.
Integration capabilities. A documented REST API enables integration with BI tools, GIS platforms, PSIM systems, and custom risk models. One financial institution's BI team (managing $5 trillion in assets under management across 247 offices) used the API to ingest crime data and change detection metrics directly into their existing risk models. Deployment requires minimal IT resources, with onboarding completed in under 30 days.
Results from enterprise deployments. A Fortune 500 CRM provider with 75,000+ employees and 100+ global offices achieved a 70% reduction in analyst time for event security preparation and covered 3x more locations with the same headcount, with implementation completed in less than 24 hours. A Fortune 10 company unified 500+ locations across 35 markets into a single dashboard, reducing assessment cycles from weeks to hours for 1.5 million employees. A Fortune 500 travel company assessed 300+ locations annually at sub-mile precision while documenting $25,000 in annual savings. As that company's leadership noted: "Security teams are no longer just relied on for the latest news reporting, but used as a concierge for travel recommendations across lodging and client entertainment."
A major financial institution's director of security summarized the impact: by providing data-driven insights that directly supported business objectives, the security function was elevated from a cost center to a strategic advantage.
See how Base Operations can transform your physical threat assessment workflow. Schedule a demo to evaluate the platform against your operational requirements.
Frequently Asked Questions About Physical Threat Assessment Platforms
What is the difference between a physical threat assessment and a physical security assessment?
A physical threat assessment evaluates the external threat landscape around a specific asset, facility, or person, identifying what threats exist and their likelihood. A physical security assessment evaluates the effectiveness of existing physical controls (cameras, access points, barriers) against those threats. Think of threat assessment as answering "what could happen here?" and security assessment as answering "how well are we protected?" Enterprise platforms increasingly combine both, linking threat intelligence directly to vulnerability analysis to produce a unified risk score.
What data sources does a physical threat assessment platform use?
Enterprise platforms aggregate data from multiple source categories: law enforcement records across jurisdictions, OSINT from social media and news feeds, crime databases and incident reports, geopolitical intelligence feeds, dark web monitoring, sensor and IoT data, and proprietary datasets from providers like CapIndex and GeoSure. The breadth and normalization quality of these sources directly impacts assessment accuracy, particularly when operating across cities or countries with inconsistent reporting standards.
How accurate are AI-driven physical threat detection systems, and how are false positives managed?
Accuracy varies significantly by vendor and threat type. Market reference points include OnSolve's 97% precision score in a DHS-funded civil unrest benchmark and Dataminr's multimedia validation approach for reducing false positives. Most platforms use layered filtering: AI-driven initial detection followed by confidence scoring and, in some cases, human analyst validation. Buyers should request independently validated accuracy metrics during evaluation, as this data is not widely published across the industry.
How does a physical threat assessment platform integrate with existing security systems?
Leading platforms offer REST APIs for integration with PSIM systems, HRIS platforms, access control systems, GIS tools like Esri, SIEM/SOAR platforms, and mass notification services. Integration depth ranges from basic data export to bidirectional API connectivity enabling automated workflows. Buyers should evaluate whether the platform supports their specific tech stack and whether integration requires custom development or uses pre-built connectors.
What compliance frameworks do physical threat assessment platforms align to?
Common framework alignments include FEMA 452 (facility vulnerability assessment), ASIS Physical Asset Protection (PAP) standard, ISO 31000 (enterprise risk management), ATAP behavioral threat assessment guidelines, and NIST SP 800-53 security controls. Framework alignment varies by vendor. Some platforms generate framework-compliant reports while others require manual mapping. Buyers should verify specific compliance certifications and reporting capabilities during evaluation.
How long does it take to implement a physical threat assessment platform?
Implementation timelines range from hours to weeks depending on deployment scope. Cloud-based SaaS platforms can be operational within 24 hours for basic access. API integrations with existing BI tools or GIS platforms typically require days to weeks of configuration. Full enterprise deployments across hundreds of locations, including user training, workflow customization, and stakeholder onboarding, generally take 4-8 weeks. The fastest path to value is starting with a focused use case and expanding.
What is the total cost of ownership for an enterprise physical threat assessment platform?
Total cost includes platform licensing ($40K-$350K per year for enterprise SaaS), implementation and configuration (typically included or $5K-$25K), user training (1-5 days per user group), and ongoing analyst time for interpretation and action. Site-based licensing runs $1,500-$3,000 per facility annually. One-time consultant assessments cost $2K-$25K per site. ROI is typically justified through incident cost avoidance, reduced analyst labor (70%+ time savings documented), insurance premium negotiation, and liability limitation.
How do physical threat assessment platforms handle privacy and GDPR compliance?
Most enterprise platforms focus on geographic and environmental threat data rather than personally identifiable information (PII), which reduces GDPR exposure. Key privacy considerations include data minimization (collecting only threat-relevant data), role-based access controls limiting who sees sensitive intelligence, data residency options for European operations, and audit logging for compliance documentation. Buyers with union environments should also evaluate whether the platform's capabilities trigger collective bargaining obligations.
Can a small security team manage a physical threat assessment platform without adding headcount?
Yes. Multiple enterprise deployments demonstrate that platforms enable small teams to expand coverage without additional staff. Documented examples include security teams covering 3x more locations with the same headcount, reducing per-location assessment time by 70-90%, and transitioning from reactive reporting to proactive advisory roles. The key is that platforms automate data collection and normalization, the tasks that consume most analyst time, freeing existing staff for higher-value analysis and decision-making.
What is the difference between a free physical security assessment template and an enterprise platform?
Free templates (from providers like RiskWatch, EasySet, or FEMA resources) provide assessment structure: checklists, scoring rubrics, and report formats. They require manual data collection, produce point-in-time snapshots, and cannot scale beyond a handful of locations. Enterprise platforms automate data collection from multiple sources, provide ongoing intelligence with dynamic risk scores, enable portfolio-wide comparison across hundreds of locations, and integrate with existing security systems. The threshold for needing a platform is typically 10+ locations or a requirement for ongoing intelligence rather than one-time assessments.
Takeaways
Join 1100+ security leaders getting new ideas on how to better protect their people and assets.