How to Scale Security Monitoring Globally: A Strategic Playbook
Build global security monitoring capability with automation, standardized methodology, and force multiplier infrastructure. 90-day implementation roadmap for enterprises.
When a Fortune 100 e-commerce and technology company's corporate security team finally admitted they had a problem, the numbers were staggering: 441 cities across the globe that needed continuous monitoring. Two analysts. The math didn't work.
"We have been for the past few years, doing this on our own internally," a security analyst at the company explained in a recent conversation. "We're starting to get to a point where they want more regular updates, and we're starting to also hit a point where it's taking up a lot of bandwidth when we need to be spending it elsewhere."
This is the moment every Corporate Security Officer dreads: when the security program that scaled perfectly from 10 to 50 locations suddenly collapses at 500. When your DIY spreadsheet system that worked for domestic operations becomes a bottleneck for international expansion. When executives expect the same quality of risk intelligence in São Paulo, Singapore, and Stockholm that you deliver in Seattle.
The stakes are real. Blind spots in high-growth markets expose your people to unnecessary risk. Reactive incident response compounds globally, turning small problems into international crises. And manual processes that consumed 20% of analyst time at 50 locations now consume 100% at 500, leaving zero capacity for strategic work.
This isn't a resource problem. It's an architecture problem. Regional security operations simply don't scale globally without a fundamental transformation in how you collect data, standardize methodology, and deploy analyst capacity.
This playbook shows you how to make that transformation: from regional reactive operations to globally standardized, proactive intelligence programs built on automation, consistent methodology, and force multiplier infrastructure. This gives you the capability to monitor 441 cities with the same team that previously struggled with 50.
Why Regional Security Operations Don't Scale Globally
Most security leaders think they understand why going global is hard. Time zones. Languages. Local regulations. Different crime reporting standards in every country.
These are symptoms, not causes.
The real reason regional security operations fail globally is that they're built on workflows that become exponentially more brittle as complexity increases. Every new country doesn't just add locations to your list—it multiplies the number of decisions, exceptions, and breaking points in your process.
The Spreadsheet Breaking Point
Here's what actually happens when you try to scale manual processes:
Your analyst in Chicago needs to assess security risk for a new office in Mexico City. They start by Googling "Mexico City crime statistics." They find three different sources with three different methodologies. One reports crime per capita. Another reports absolute numbers. A third uses a proprietary risk score with no explanation of the underlying data.
None of them break down crime by neighborhood—and your office is in Polanco, not the tourist district.
So your analyst spends three hours researching local news sources, translating articles, cross-referencing police reports, and building a risk assessment from scratch. They create a custom scoring methodology for Mexico City because nothing else is comparable to how you assess risk in Chicago.
Next month, your CEO asks: "How does Mexico City compare to our São Paulo office?"
Your analyst has no idea. Because São Paulo was assessed by a different analyst using a different methodology with different sources. The spreadsheets aren't compatible. The risk scores aren't comparable. The underlying data represents different things.
This is workflow brittleness (WF-001) at scale—spreadsheet-based processes that break with every stakeholder change, every new jurisdiction, every attempt to compare locations.
The Standardization Problem
"Every jurisdiction reports differently," a global logistics provider's security director told us during their evaluation. "No standardized global database exists. Each jurisdiction has its own format. We felt we had to maintain control over data quality."
This is why you see security teams manually collecting data from 441 global jurisdiction. They don't trust anyone else to do it consistently.
The problem compounds with every new region:
North America: Some cities publish open data APIs. Others require FOIA requests. Some update monthly. Others update annually—usually in Q2, when last year's government reports finally get published.
Europe: GDPR restricts what crime data can be published. Some countries report at the city level. Others only report regionally. Terminology differs: "assault" in the UK doesn't map directly to "aggressione" in Italy.
Latin America: Data availability varies dramatically. Brazil's major cities publish detailed statistics. Smaller cities in other countries might publish nothing. When they do publish, it's often in local formats that require significant processing to standardize.
Asia-Pacific: Some countries (Australia, Singapore) have transparent, well-structured data. Others have limited public reporting. The definition of what constitutes a "property crime" varies significantly by jurisdiction.
Without global data standardization (WF-003), every country becomes its own project. And when you need to answer the simple question "Which of our 500 global locations need additional security resources?" you're stuck doing manual aggregation for weeks.
The Reactive Posture Amplified
"Ultimately, you'd be saving us money too because we're proactively assessing risk as opposed to right now, we're just on defense," a security director at a major logistics company explained. "Just wait for the next bad thing to happen."
Being stuck in reactive defense mode is frustrating when you have 50 locations. It's catastrophic when you have 500.
Here's why reactive security compounds globally:
Incident in Mumbai triggers review cycle: Your team spends a week investigating what happened, collecting local data, and updating the risk assessment for that specific location.
Meanwhile, crime is increasing in Mexico City: But you don't know because you're not monitoring month-to-month changes. You only reassess when there's an incident or when annual review cycles come around.
São Paulo escalation goes unnoticed: Your Q2 risk assessment showed moderate risk. By Q4, the neighborhood around your office has deteriorated significantly—but your next scheduled review isn't until Q2 next year.
Manila expansion gets rubber-stamped: Real estate found a great office space. They need security sign-off in 72 hours. You don't have bandwidth to do a proper assessment, so you rely on "gut feel" and general city-level statistics.
At 50 locations, reactive posture means you're always one crisis behind. At 500 locations, it means you have systematic blind spots across entire regions because you simply don't have capacity to be proactive globally.
The Global Security Monitoring Maturity Model
Understanding where you are—and where you need to be—is the first step in transformation. Most organizations attempting global security monitoring fall into one of four maturity levels:
Level 1: Ad-Hoc Regional (Where Most Start)
Characteristics:
- No standardization across geographies
- Manual data collection for each location assessment
- Reactive incident response drives security decisions
- Different analysts use different methodologies
- No systematic monitoring—only assessments when requested
- Spreadsheet-based tracking with no version control
Typical Scale: 10-50 locations, primarily domestic or single region
Analyst Experience: "We're starting to hit a point where it's taking up a lot of bandwidth when we need to be spending it elsewhere."
This is where your DIY approach breaks. It worked fine when you had 20 US locations and one analyst could handle quarterly assessments. But now you have 200 locations across 30 countries, executives want monthly updates, and your analyst spends 100% of their time on manual data collection.
Level 2: Regional Centers (The Expensive Middle)
Characteristics:
- Geographic hub structure (Americas, EMEA, APAC)
- Regional teams with some local expertise
- Inconsistent methodologies across regions
- Some automation within regions, not across them
- Still primarily reactive with pockets of proactive monitoring
- Risk scoring exists but isn't comparable across regions
Typical Scale: 50-200 locations across multiple regions
Common Problem: "How does our London office compare to our Singapore office?" becomes an impossible question because regional teams assess risk differently.
Most organizations get stuck here. They solve the domestic scaling problem by adding regional teams, but they create a new problem: global inconsistency. Your EMEA security director uses one risk framework. Your APAC director uses another. Your executives can't compare risks or allocate resources rationally.
Level 3: Centralized Global (The Transformation Goal)
Characteristics:
- Unified platform for global monitoring
- Standardized risk scoring methodology across all locations
- Automated data collection and normalization
- Proactive monitoring with exception-based alerts
- Monthly updates without proportional analyst growth
- Comparable risk assessments across all jurisdictions
Typical Scale: 200-1,000+ locations globally
Capability Unlocked: "We can monitor 441 cities with a team of two."
This is where a Global 3PL scaled their route security analysis 4x while cutting assessment costs 75%. Same team. Four times the coverage. Because the platform does the heavy lifting of data collection and standardization.
Level 4: Intelligence-Driven Global (The Strategic Advantage)
Characteristics:
- Predictive analytics identifying risk trends before incidents
- Exception-based operations—analysts focus only on significant changes
- Force multiplier infrastructure enables 200:1 location-to-analyst ratios
- Integration with real estate, travel, and executive protection workflows
- Regional SME overlays add local context to automated baselines
- Security becomes strategic business enabler, not cost center
Typical Scale: 500-10,000+ locations globally
Business Impact: Security capabilities become competitive differentiators in RFPs and customer conversations.
The global 3PL we mentioned reached this level—their advanced route analysis framework became a value-add for customers during long-term freight arrangement negotiations. Security transformed from cost center to revenue enabler.
Building the Foundation: Global Data Standardization
You can't scale globally without solving the standardization problem first. Every city reports crime differently. Every country uses different classifications. Every source updates on different schedules with different methodologies.
This is why global security monitoring fails. Not because the data doesn't exist. It does. But because aggregating, normalizing, and standardizing that data manually is impossible at scale.
The Problem: Apples-to-Oranges Comparison Everywhere
Let's say you need to compare risk levels across three offices: Chicago, London, and São Paulo.
Chicago: City publishes detailed crime data via open API. Updates weekly. Uses FBI Uniform Crime Reporting classifications. Data includes exact location coordinates for every incident.
London: Metropolitan Police publishes monthly data with 2-month lag. Uses UK Home Office crime categories (not compatible with FBI UCR). Location data is anonymized to protect victim privacy—you get neighborhood-level data only.
São Paulo: State of São Paulo publishes data quarterly. Uses Brazilian classification system. Some crime types combine what US sources separate. Historical data requires purchasing from third-party aggregators.
Your analyst faces impossible questions:
- Does a "violent theft" in São Paulo equal a "robbery" in Chicago?
- How do you account for the 2-month reporting lag in London?
- When São Paulo reports crime at the district level and Chicago reports at the block level, how do you create comparable "threat within 0.5 miles of office" metrics?
Most security teams respond to this complexity by giving up on standardization. They create location-specific assessments that can't be compared. Or they oversimplify by using city-wide statistics that miss critical neighborhood-level variations.
Neither approach works for resource allocation. If you can't compare risk levels objectively, you can't prioritize where to deploy security resources, where to invest in additional measures, or where to advise real estate against expansion.
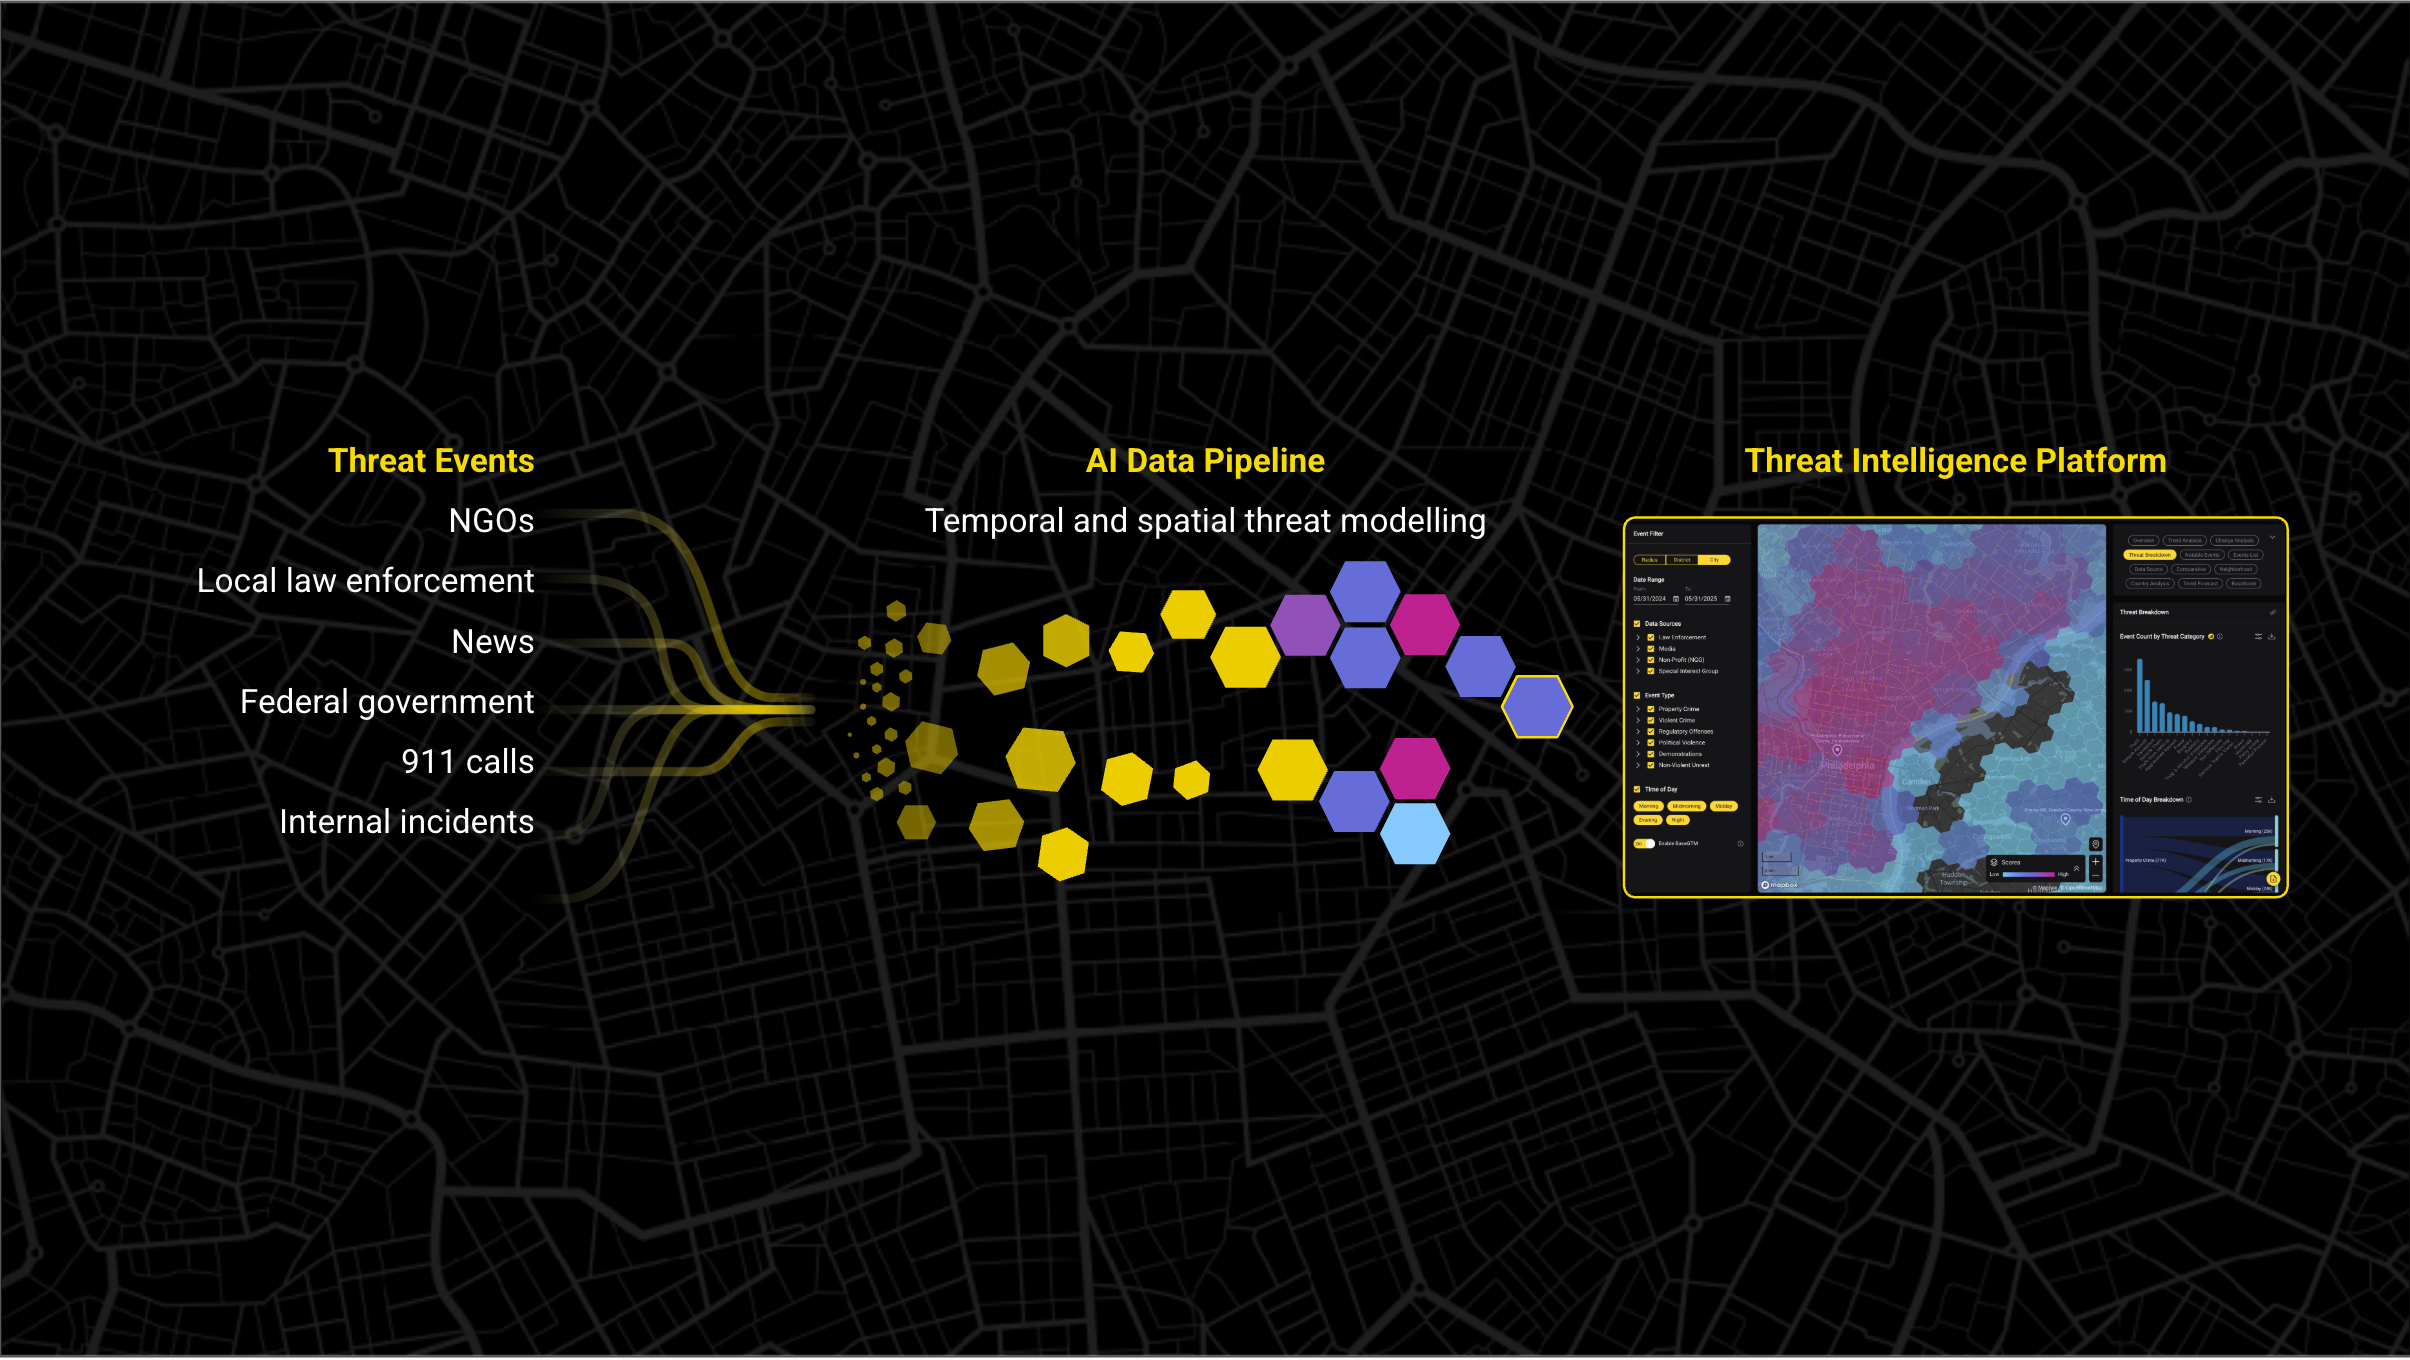
The Solution: Unified Risk Ontology with Global Coverage
Standardization requires three components:
1. Consistent Geographic Framework
The H3 grid system provides globally consistent hexagonal coverage at multiple resolutions. Whether you're assessing risk in downtown Chicago or suburban São Paulo, the grid structure is identical. This enables apples-to-apples comparison because the underlying geographic framework is standardized.
Instead of comparing "within 0.5 miles" (where the data density varies by jurisdiction), you're comparing "threat level within H3 resolution 9 hexagons" (consistent globally).
2. Unified Threat Taxonomy
A standardized classification maps local crime reporting to consistent global categories:
- Violent Crime: Assault, robbery, sexual assault (maps across FBI UCR, UK Home Office, Brazilian classifications)
- Property Crime: Burglary, theft, vandalism (normalized for reporting differences)
- Vehicle Crime: Auto theft, carjacking (accounts for regional variations in definitions)
- Disorder: Public nuisance, disorderly conduct (filters out low-severity noise)
This taxonomy isn't just translation—it's normalization. When São Paulo reports "roubo" (theft without violence) separately from "roubo com violência" (violent theft), the taxonomy correctly categorizes them into property crime and violent crime respectively. When London combines some theft types that Chicago separates, the taxonomy unbundles them for consistency.
3. Automated Data Normalization at Scale
Manual standardization breaks at global scale. You need automated pipelines that:
- Ingest 25,000+ global data sources
- Apply consistent methodology to normalize reporting differences
- Update monthly (or more frequently where data permits)
- Map every incident to the standardized taxonomy and geographic grid
- Calculate comparable risk scores using the same formula globally
This is how a Global 3PL monitors 441 cities with consistent BaseScore methodology. They don't have 441 analysts manually researching 441 different jurisdictions. They have automated data normalization providing standardized risk assessments globally.
What Standardization Unlocks
When you can compare risk objectively across global locations, entire workflows transform:
Resource Allocation: "Our top 10 highest-risk locations globally need additional security measures" becomes a data-backed decision instead of political negotiation.
Real Estate Decisions: "The São Paulo site option is 30% lower risk than the Rio de Janeiro option" gives executives objective criteria for site selection.
Executive Protection: "Travel risk increased 15% in Istanbul this month" triggers proactive route adjustments instead of reactive incident response.
Portfolio Monitoring: "Three locations in our APAC portfolio experienced significant crime increases this quarter" surfaces automatically instead of waiting for local incidents to escalate.
Budget Justification: "Investing in additional security for these 12 locations is justified by quantified risk levels" replaces "we need more budget because we had incidents."
Standardization is the foundation. Without it, global security monitoring is just expensive chaos.
Technology Infrastructure for Global Scale
Standardization is necessary but not sufficient. You also need technology infrastructure designed for global scale from day one.
Most security platforms are built for domestic operations and retrofitted for international use. You can tell because they:
- Require manual configuration for each new country
- Support limited geographies (usually US + Western Europe)
- Charge per-seat, making global rollout prohibitively expensive
- Lack multi-language interfaces for regional teams
- Update data on domestic schedules (ignoring time zones and regional reporting cycles)
This creates operational friction. Your LATAM security analyst has to use an English-only interface. Your APAC team waits days for "real-time" alerts because the system batch processes overnight US time. Your European offices aren't covered because the vendor doesn't support GDPR-compliant data sources.
Five Requirements for Global Security Infrastructure
1. Global Coverage Out-of-the-Box (5,000+ Cities Pre-Configured)
When your CFO announces expansion into Vietnam, you need coverage immediately—not a 6-month implementation project.
Pre-configured global coverage means:
- 5,000+ cities across 150+ countries already mapped
- Data sources identified, integrated, and normalized
- H3 grid coverage established globally
- BaseScore methodology calibrated for local conditions
- No manual setup required for new markets
"We need to cover the whole world," a Fortune 500 security director told us during their evaluation. Manual scaling doesn't work. You need instant coverage for new markets as business requirements evolve.
2. Automated Data Collection at Scale (25,000+ Sources)
Manual data hunting is the bottleneck that prevents global scaling.
The right infrastructure provides:
- 25,000+ global data sources pre-integrated
- Automated monthly updates (or more frequent where available)
- No analyst time required for data collection
- 150M+ incidents continuously mapped and normalized
- Consistent methodology applied across all sources
This is how security teams achieve 70% time reduction at scale. A Top 25 retailer now monitors 8,500+ sites with standardized methodology. The platform eliminates manual data collection entirely.
3. API-First Architecture for Enterprise Integration
Global security programs don't exist in isolation. They need to integrate with:
- Global Security Operations Centers (GSOC)
- Security Operations Centers (SOC)
- Travel management systems
- Executive protection platforms
- Real estate decision tools
- Business intelligence dashboards
REST API architecture enables:
- Programmatic access to global risk data
- Automated alerting to existing security systems
- Integration with travel booking workflows
- Executive dashboards showing global risk portfolio
- Custom reporting for regional requirements
Enterprise customers use APIs to build automated workflows—triggering executive protection protocols when travel destinations experience risk increases, feeding real estate site selection tools, populating regional GSOC dashboards.
4. Multi-Language Support for Regional Teams
Global operations require global usability.
Your São Paulo analyst shouldn't need to translate English interfaces. Your Tokyo GSOC operator shouldn't work in a foreign language. Regional teams need native-language workflows.
This means:
- Local news translations
- Localized date/time formats
- Regional numbering conventions
- Cultural adaptations for risk visualization
- Documentation in regional languages
5. Scalable Pricing (Not Per-Seat for Global Headcount)
Per-seat pricing kills global adoption.
If you charge $500/seat and a global security program has 50 people across regional GSOC teams, the price becomes $25,000/month just for seats—before considering location or data costs.
This creates perverse incentives: limiting platform access to minimize costs, preventing regional analysts from using tools they need, centralizing everything in one location to reduce seats.
Scalable pricing should be based on:
- Location coverage (not seats)
- Data consumption (not team size)
- Value delivered (not arbitrary per-user fees)
This enables natural adoption patterns, giving platform access to everyone who needs it without worrying about seat count optimization.
The Deployment Reality: Under 30 Days
When the Fortune 100 company's security team needed to scale to 441 cities, they didn't have 6 months for implementation. They needed coverage fast.
The right technology infrastructure enables rapid deployment:
Week 1: Platform provisioning, SSO integration, initial user setup
Week 2: Location portfolio upload, risk baseline generation
Week 3: Analyst training, workflow customization
Week 4: Full production operation with complete global coverage
Under 30 days from contract signature to full global monitoring capability.
Compare this to the alternative: hiring analysts to manually monitor 441 cities. At a 50:1 location-to-analyst ratio (the best you can achieve manually), you'd need 9 analysts. Assuming $120K fully loaded cost per analyst, that's $1.08M annually. And you still wouldn't have standardized methodology or comparable risk scores.
The technology infrastructure investment pays for itself immediately. Not because it's cheap, but because the alternative is operationally impossible.
Organizational Models: Centralized vs. Hub-and-Spoke vs. Federated
Technology enables global scaling. But organizational structure determines how effectively you use that technology.
Three common models emerge when security programs go global:
Model 1: Centralized (Single Global Team)
Structure: One security operations team (typically 2-5 analysts) monitors all global locations from a central hub (usually US or Europe).
Advantages:
- Maximum consistency in risk assessment methodology
- Efficient use of analyst resources (no duplication)
- Clear accountability—one team owns global program
- Easiest to implement and manage
- Lowest total cost for analyst headcount
Disadvantages:
- May lack deep local knowledge of regional nuances
- Time zone challenges for real-time response
- Potential cultural blind spots in risk interpretation
- Limited boots-on-ground validation capability
Best For: Organizations with 100-500 global locations where consistency matters more than local expertise; companies with limited security budgets needing efficient coverage; businesses with standardized global operations (retail, logistics, manufacturing).
Resource Efficiency: This model achieves the best location-to-analyst ratios (200:1 or higher with the right technology). The Global 3PL achieved 4x capacity increase using this model because centralization eliminates duplication.
Model 2: Hub-and-Spoke (Regional Centers with Central Coordination)
Structure: Regional security hubs (Americas, EMEA, APAC) with local analyst teams, coordinated by a global security operations center.
Advantages:
- Balanced approach combining consistency and local knowledge
- Regional expertise for cultural context and language
- Better time zone coverage for real-time monitoring
- Local relationships with law enforcement and vendors
- Ability to validate automated intelligence with local context
Disadvantages:
- Higher cost (3-4 regional analysts plus central coordination)
- Risk of methodology drift between regions
- Potential for regional silos if not well-coordinated
- Requires strong central governance to maintain standards
Best For: Large multinational corporations (1,000+ locations) with significant operations in multiple regions; organizations with regulatory requirements for local security expertise; companies operating in high-risk environments where local knowledge is critical.
Implementation Key: Centralized platform + regional execution. All regions use the same Base Operations platform for data and methodology, but regional analysts add local context and validation.
Model 3: Federated (Regional Autonomy with Shared Platform)
Structure: Regional security teams operate independently with autonomy for local decision-making, sharing a common technology platform for data and reporting.
Advantages:
- Maximum flexibility for regional adaptation
- Deep local expertise and cultural understanding
- Empowers regional leaders to own security programs
- Accommodates regional regulatory differences
- Faster local decision-making without central bottlenecks
Disadvantages:
- Highest risk of inconsistent methodology
- Difficult to compare risk across regions objectively
- Potential for inefficient resource duplication
- Requires strong platform governance to prevent fragmentation
- Most expensive headcount model
Best For: Decentralized global enterprises with strong regional business units; organizations where local regulations require regional security autonomy; companies acquiring businesses that need to maintain some independence.
Critical Success Factor: Technology standardization is non-negotiable. Regional autonomy for execution is fine—regional differences in data sources or methodology is not.
The Recommended Approach: Centralized Platform + Regional Expertise Overlay
Most successful global security programs combine centralized efficiency with regional expertise:
Foundation: Centralized platform (Base Operations) provides automated global baseline monitoring with standardized methodology.
Layer 1: Small central team (2-3 analysts) monitors global portfolio using automated intelligence, exception-based alerts, and standardized reporting.
Layer 2: Regional subject matter experts (often part-time or consultative) validate high-risk alerts with local context, cultural understanding, and boots-on-ground intelligence.
Layer 3: Executive escalation process uses globally consistent thresholds—when any location crosses critical risk levels, the response protocol is standardized.
This model appears in our most successful customer implementations:
- A global consultancy: 1 central analyst + GSOC team access achieved 35% efficiency improvement across 75+ global offices
- A global 3PL: Team of 2 covering 441 cities with regional validation
- A Fortune 500 retailer: Central intelligence team + regional security directors for escalation
Why This Works:
Automation handles the 90% case: routine monitoring, standard risk assessment, monthly updates. Human expertise focuses on the 10% that requires judgment: significant risk changes, local cultural context, strategic recommendations.
Regional involvement is consultative, not operational. When automated intelligence flags a 30% crime increase near your Mumbai office, your regional SME validates: "Yes, this matches what we're seeing locally. There's been a spike in tech company targeting." Or: "No, this is a reporting artifact. The police changed how they classify incidents."
You get both global consistency and local wisdom without the cost of fully staffed regional security centers.
Maintaining Quality at Global Scale: The Force Multiplier Approach
Here's the uncomfortable truth about global security monitoring: you can't scale headcount proportionally to location growth.
If monitoring 50 locations requires 1 analyst, monitoring 500 locations should require 10 analysts, right? And 5,000 locations would require 100 analysts.
Except no organization will approve 100 security analyst positions. That's $12M in annual headcount cost before you consider managers, tools, and infrastructure.
This is the scaling crisis that breaks security programs: "We have a team of two to cover the whole world. So we're doing what we can with the bandwidth that we currently have, and that is primarily just react and respond."
The force multiplier approach solves this by fundamentally changing what analysts spend time on.
The Bandwidth Problem
Traditional security monitoring consumes analyst time in three categories:
Data Collection (50-60% of time):
- Researching local crime sources
- Downloading police reports
- Aggregating data from municipal websites
- Standardizing formats
- Updating spreadsheets
Analysis (20-30% of time):
- Calculating risk scores
- Identifying trends
- Comparing locations
- Creating reports
- Responding to stakeholder requests
Strategic Work (10-20% of time if lucky, 0% if not):
- Proactive threat identification
- Executive protection planning
- Real estate security consultation
- Security program optimization
- Cross-functional collaboration
The problem: data collection scales linearly with locations. Double your locations, double the data collection time. At some point (usually around 100-200 locations), data collection consumes 100% of analyst time. Analysis gets squeezed. Strategic work disappears entirely.
"We're starting to hit a point where it's taking up a lot of bandwidth when we need to be spending it elsewhere," the Fortune 100 company's security team explained. They weren't drowning in analysis. They were drowning in manual data collection.
The Force Multiplier Solution: Automate the 90%, Focus on the 10%
The force multiplier approach inverts the time allocation:
Data Collection (0% of analyst time):
- Platform automatically ingests 25,000+ global sources
- Monthly updates happen without analyst involvement
- BaseScore calculation is automated globally
- Change detection flags significant shifts automatically
- No manual research, no spreadsheet updates
Exception-Based Analysis (30-40% of time):
- Analysts review only significant changes (20%+ monthly shifts)
- Automated alerts (via API) surface locations requiring attention
- Pre-calculated comparisons show relative risk
- Standardized reports generated automatically
- Focus on interpretation, not calculation
Strategic Work (60-70% of time):
- Proactive portfolio risk reviews
- Executive protection intelligence
- Real estate security consultation
- Cross-regional pattern analysis
- Security program optimization
This is how teams achieve 4x capacity increases without adding headcount. It eliminates 50-60% of their manual research work entirely.
The Math: From 50:1 to 200:1 Location-to-Analyst Ratios
Let's quantify the force multiplier effect:
Traditional Manual Approach:
- 1 analyst can manually monitor ~50 locations (quarterly assessments)
- Time allocation: 60% data collection, 30% analysis, 10% strategic
- To monitor 441 locations requires: 9 analysts at ~50:1 ratio
- Cost: $1.08M annually (9 analysts × $120K fully loaded)
Force Multiplier Approach:
- 2 analysts monitor 441 locations with automated intelligence
- Time allocation: 0% data collection, 40% exception analysis, 60% strategic
- Location-to-analyst ratio: 220:1
- Cost: $240K annually (2 analysts × $120K fully loaded)
Savings: $840K annually (78% reduction)
Quality Improvement: More frequent updates (monthly vs quarterly), standardized methodology, proactive risk identification
This isn't theoretical. A Top 25 retailer achieved 70% time reduction monitoring 8,500+ sites with standardized methodology. A Global 3PL scaled from 50:1 to 200:1 ratios.
Exception-Based Operations: What Actually Requires Human Attention?
Not every location change requires analyst attention. The force multiplier approach distinguishes between automated baseline monitoring and exception-based analysis.
Automated Baseline (No Analyst Required):
- Monthly BaseScore updates for all locations
- Routine crime pattern tracking
- Standard reporting for executive dashboards
- Historical trend visualization
- Portfolio-level statistics
Exception-Based Analysis (Analyst Focus):
- 20%+ month-over-month risk increase at any location
- New locations entering "high risk" threshold
- Significant changes in specific threat categories
- Regional patterns affecting multiple locations
- Unusual temporal changes (sudden spikes)
This filtering is critical. Without it, analysts drown in data. With 441 locations updating monthly, you have 441 potential changes to review every month. But only 20-30 typically cross exception thresholds requiring investigation.
Regional SME Overlay: Adding Local Context When Needed
Automation provides global baseline. Regional expertise adds context when it matters.
Example: Latin America Expansion
Your platform flags a 25% crime increase near your São Paulo office. This crosses your exception threshold and triggers analyst review.
Automated Intelligence Provides:
- 25% increase in property crime within 0.5 miles
- Specific threat categories (theft, robbery)
- Temporal patterns (increase concentrated in evening hours)
- Comparison to historical trends (highest level in 18 months)
Regional SME Validation Adds:
- Local context: "This matches regional economic stress—unemployment up 3% this quarter"
- Cultural insight: "Property crime in this area typically targets businesses, not individuals"
- Tactical recommendation: "Consider additional evening security during Brazilian holidays when retail targets increase"
- Boots-on-ground confirmation: "Our local security team reports increased vagrancy in the area"
The automated intelligence identifies what changed. The regional expert explains why it matters and what to do about it.
Strategic Portfolio Analysis: Quarterly Global Trends
With bandwidth recovered from manual data collection, analysts can conduct strategic work previously impossible:
Global Pattern Recognition:
- Identifying crime trends affecting multiple APAC locations
- Recognizing regional economic factors driving security changes
- Detecting systemic issues (all locations near transportation hubs showing similar increases)
Proactive Risk Mitigation:
- Forecasting which locations will likely cross high-risk thresholds next quarter
- Recommending security investments based on portfolio-wide analysis
- Advising real estate on security implications of expansion plans
Executive Intelligence:
- Quarterly security briefings showing global risk trends
- Data-backed budget requests tied to quantified risk levels
- Strategic recommendations for security program optimization
This is what separates reactive security teams from strategic security teams. Reactive teams spend all their time collecting data and responding to incidents. Strategic teams use automated intelligence to anticipate problems and advise the business proactively.
Regional Intelligence Integration: Balancing Global Standards with Local Context
Global standardization and regional expertise seem contradictory. You need consistent methodology to compare locations objectively. But you also need local context to interpret what the data means.
The tension is real. Overemphasize global standards and you miss critical local nuances. Overemphasize regional autonomy and you cannot compare locations or allocate resources rationally.
The solution isn't choosing one approach. It's layering both strategically.
The Four-Layer Framework
Layer 1: Global Baseline (Automated for All Locations)
Base Operations provides automated BaseScore for every location globally. Same methodology. Same data sources. Same update frequency. No analyst time required.
This establishes objective risk levels across your entire portfolio. Whether you have 10 locations or 10,000, every location gets continuous monitoring with standardized risk assessment.
No human bias. No resource constraints. No political influence on risk scores.
Layer 2: Exception-Based Alerts (Significant Changes Flagged Automatically)
The platform identifies locations experiencing meaningful risk changes:
- 20%+ month-over-month shifts in BaseScore
- New locations crossing high-risk thresholds
- Unusual concentration of specific threat types
- Regional patterns affecting multiple locations simultaneously
This filters thousands of routine updates into dozens of items requiring analyst attention.
Your global portfolio might include 500 locations updating monthly. That's 6,000 updates annually. But only 300-400 (5-7%) cross exception thresholds requiring human review.
Layer 3: Regional SME Validation (Local Context for High-Risk Alerts)
When automated intelligence flags significant changes (via API), regional analysts validate with local expertise:
The Alert: "Mexico City office location experienced 30% increase in violent crime this month"
Regional Validation Questions:
- Is this a real trend or a reporting artifact?
- Does this match what local contacts are seeing?
- Are specific factors driving the increase (protests, economic conditions)?
- What tactical recommendations should we make?
- Do we need to escalate to executive protection protocols?
Regional analysts don't recalculate the risk score. The automated baseline stands. They interpret what it means and recommend appropriate response.
Layer 4: Executive Escalation (Globally Consistent Thresholds)
When any location crosses critical risk levels, the escalation process is standardized globally:
High Risk Threshold Crossed → Regional Director Notification
- Automated alert within 24 hours
- Standardized briefing template
- Recommended actions checklist
Critical Risk Threshold Crossed → Executive Protection Activation
- Global security director notification
- Travel restriction recommendations
- Enhanced security measures implementation
- Board-level reporting if necessary
The thresholds are consistent worldwide. An office in Mumbai that crosses the "critical" threshold triggers the same executive response as an office in Mexico City. No geographic bias. No political negotiation.
Example in Practice: Latin America Regional Security Team
A Fortune 500 company's Latin America security director uses this layered approach:
Monthly Workflow:
- Platform generates automated BaseScore updates for 75 LATAM locations
- Exception alerts flag 4 locations with significant changes (eg workflow built via API notifies of 5% of portfolio with significant changes)
- Regional director reviews the 4 alerts in detail:
- Buenos Aires: 22% crime increase → Validates as real, driven by economic crisis
- São Paulo: 25% decrease → Confirms, notes improved police presence after mayoral election
- Monterrey: 31% increase → Identifies as reporting change, not real crime increase
- Bogotá: 18% increase → Monitors but doesn't escalate (below 20% threshold)
- Regional director provides context to global security leadership
- São Paulo location removed from enhanced security protocol (improvement validated)
- Buenos Aires location escalated for additional security measures
Time Investment: 4 hours monthly (vs. 40+ hours if manually assessing all 75 locations)
Quality Improvement: Every location monitored monthly (vs. quarterly with manual approach), with regional validation for significant changes
Cultural Context Matters: When Regional Expertise is Critical
Automated intelligence identifies patterns. Regional expertise explains why they matter.
Example 1: Brazilian Holiday Security Dynamics
Automated Alert (via API): "Property crime increased 40% near São Paulo office during Carnaval week"
Regional Context: "This is expected and repeats annually. Our local security team prepares by adjusting schedules during this period. Not a cause for concern, just seasonal variation."
Without regional context, you might panic about a 40% spike. With it, you recognize a predictable seasonal pattern that's already addressed in local security protocols.
Example 2: Japanese Reporting Culture
Automated Alert: "Tokyo office shows consistently lower crime rates compared to similarly-sized offices globally"
Regional Context: "Japanese culture has lower crime reporting rates. Many incidents are handled informally. The data is accurate for what's reported, but systematic underreporting means we should maintain higher security protocols than the raw numbers suggest."
Regional experts understand what the data doesn't show: cultural factors affecting reporting rates, informal resolution systems, social dynamics influencing crime patterns.
Example 3: European GDPR Limitations
Automated Alert: "Berlin office shows large gaps in historical crime data availability"
Regional Context: "German privacy regulations restrict crime data publication more than other EU countries. We supplement automated intelligence with local police partnerships and private security consultants who have access to non-public data."
Regional teams know when to trust automated intelligence at face value and when additional local validation is required.
The Balance: Trust but Verify
The framework creates productive tension:
Trust: Automated global baseline provides objective risk assessment. Don't second-guess the methodology or create alternative scoring systems. The standardization is the value.
Verify: Regional experts validate that automated intelligence correctly interprets local conditions. When there are discrepancies, dig deeper to understand why.
Escalate Strategically: Not every regional insight requires changing global standards. Document local context for executive decision-making, but maintain global consistency unless there's compelling evidence that methodology needs regional adjustment.
This balance enables both global consistency and local wisdom—without collapsing into either rigid centralization or chaotic regional fragmentation.
Real-World Example: How a Fortune 500 Company Built Global Monitoring in 90 Days
The logistics company's challenge was immediate and unforgiving: expand security monitoring from 100 North American locations to 500 global locations in the same quarter they acquired a European competitor.
Their existing approach—5 analysts manually assessing locations using spreadsheets—couldn't scale. At their current pace, comprehensive global coverage would require 25 analysts. The CFO's response: "Figure out how to do it without 20 new headcount requests."
This is the moment when security programs either transform or collapse.
Month 1: Foundation and Deployment
Week 1: Platform Deployment and Footprint Mapping
The security team began by cataloging every current and planned location:
- 100 existing North American locations
- 280 locations from the European acquisition
- 120 planned expansion sites (APAC and LATAM)
- Total footprint: 500 locations across 45 countries
Base Operations was provisioned with SSO integration and user access for the 5-person security team. The entire global footprint was uploaded—500 locations covering North America, Europe, Latin America, and Asia-Pacific.
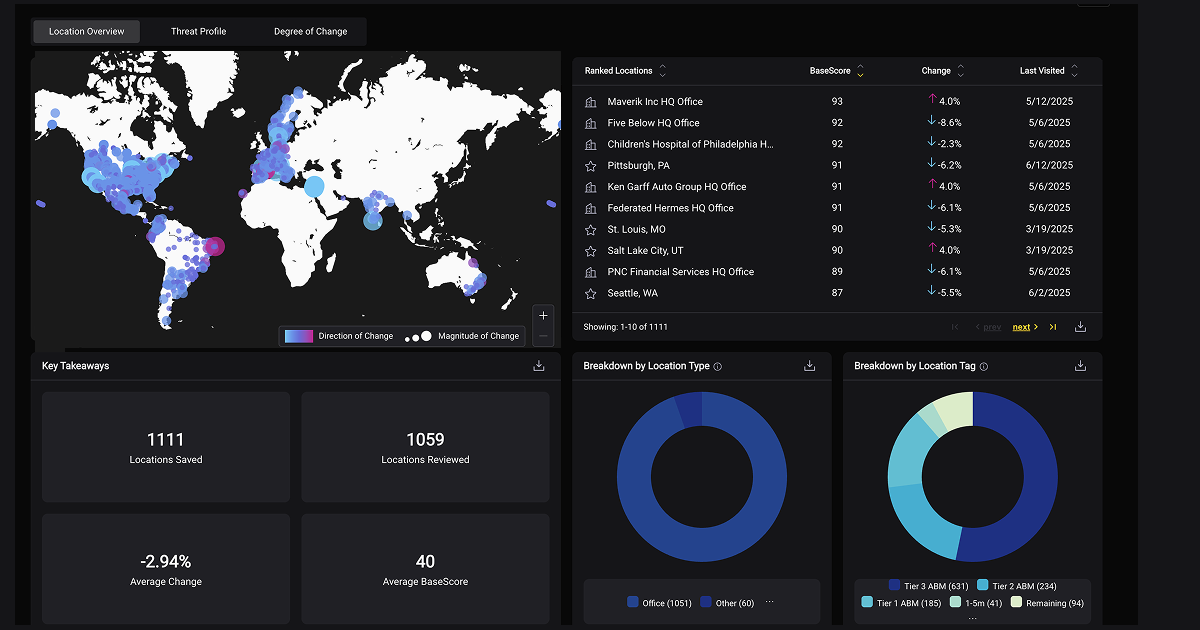
Week 2: Automated Baseline Risk Assessment
The platform generated initial BaseScore risk assessments for all 500 locations. For the first time, the security director could answer previously impossible questions:
- "What are our 25 highest-risk locations globally?" (Answer: 18 in Latin America, 5 in Eastern Europe, 2 in North America)
- "Which regions have the most volatile risk profiles?" (Answer: Latin America and Eastern Europe showing frequent monthly changes)
- "Where should we prioritize additional security investments?" (Answer: Data-backed ranking of locations by risk level)
Week 3: Analyst Training and Workflow Design
The 5-person security team completed platform training, focusing on:
- Exception-based monitoring workflows
- Regional validation protocols
- Executive reporting templates
- Integration with existing GSOC systems
The team designed their new operating model:
- 3 analysts monitoring global portfolio using exception-based alerts
- 2 analysts focused on strategic work (real estate consultation, executive protection, program optimization)
Week 4: Regional SME Identification
The team identified regional subject matter experts:
- North America: Existing security directors at major facilities
- Europe: Acquired company's security leadership (part-time consultative)
- Latin America: External consultant with regional expertise
- Asia-Pacific: Local facility managers with security backgrounds
These SMEs wouldn't do primary monitoring—they'd validate automated intelligence when significant changes required local context.
Month 2: Optimization and Integration
Week 5-6: Exception Threshold Calibration
The first month of operation generated baseline data showing normal variation across the global portfolio. The team calibrated exception thresholds:
- 20% month-over-month change triggers routine analyst review
- 35% change triggers regional SME consultation
- 50% change or crossing into "high risk" triggers executive notification
Week 7-8: GSOC Integration
The platform's REST API was integrated with the company's Global Security Operations Center dashboard, enabling:
- Automated daily briefings showing global portfolio status
- Real-time alerts when locations crossed risk thresholds
- Executive dashboard displaying top 50 highest-risk locations
- Integration with travel management system for duty-of-care protocols
Month 3: Full Production Operation
Week 9-10: Regional Rollout Validation
The team conducted regional validation exercises:
Europe: Regional security directors confirmed automated intelligence matched their ground truth for 23 of 25 highest-risk locations. Two discrepancies were explained by recent police precinct boundary changes (now documented).
Latin America: External consultant validated risk rankings and provided additional context for locations near informal settlements not captured in official crime data.
Asia-Pacific: Facilities teams confirmed that automated assessments identified the same locations they'd flagged based on local incident history.
Week 11: Executive Briefing and Budget Planning
The security director presented the first comprehensive global risk briefing to executive leadership:
- "Our global portfolio includes 47 high-risk locations requiring enhanced security measures"
- "Risk in our LATAM expansion markets is 30% higher than anticipated—recommend delaying 3 planned openings until security infrastructure is in place"
- "European acquisition locations are generally lower risk than our North American portfolio—opportunity to reallocate security resources"
For the first time, these statements were backed by quantified, comparable data.
Week 12: Strategic Work Reallocation
With global monitoring automated, the security team redirected recovered bandwidth:
- Real Estate Support: Increased from 3 site assessments per quarter to 15 (5x improvement)
- Executive Protection: Launched proactive travel risk assessment program for C-suite
- Portfolio Optimization: Conducted first-ever comprehensive review of security resource allocation efficiency
Results After 90 Days
Coverage: 500 global locations monitored consistently with standardized methodology
Team Size: Same 5 analysts (no new headcount required)
Location-to-Analyst Ratio: Improved from 20:1 to 100:1
Update Frequency: Increased from quarterly to monthly without additional analyst time
Strategic Bandwidth: 60% of analyst time now allocated to strategic work vs. 10% previously
Executive Satisfaction: First comprehensive global risk briefing received board-level recognition
Budget Impact: Avoided $2.4M in planned security analyst hiring (20 headcount × $120K)
The Critical Success Factors
What made this 90-day transformation possible:
1. Executive Sponsorship: Security director had CFO support to implement new approach vs. hiring proportionally
2. Technology Foundation: Pre-configured global coverage eliminated months of manual setup
3. Workflow Discipline: Team committed to exception-based monitoring vs. manually reviewing every location
4. Regional Partnership: Leveraged existing relationships for SME validation vs. building regional teams
5. Integration Focus: Connected platform to existing GSOC systems vs. creating standalone workflows
This wasn't a pilot project. It was full production deployment from day one. The business need was immediate and the traditional approach (proportional headcount scaling) was impossible.
How Base Operations Enables Global Security Monitoring at Scale
By now, you understand the transformation required: from regional reactive operations to global proactive intelligence. From manual data collection to automated monitoring. From analyst bandwidth drain to force multiplier efficiency.
The remaining question: How does Base Operations specifically enable this transformation?
Instant Global Coverage: 5,000+ Cities Pre-Configured
When your CFO announces expansion into Chile, Colombia, and Thailand, you don't have 6 months for security infrastructure setup.
Base Operations provides immediate coverage:
- 5,000+ cities across 150+ countries already mapped
- 25,000+ data sources integrated globally
- H3 grid coverage established worldwide for consistent geographic analysis
- 150M+ incidents continuously mapped and normalized
- Zero manual setup required for new markets
This is why customers deploy in under 30 days. The global infrastructure already exists. You're not building it from scratch.
Standardized BaseScore Methodology: Apples-to-Apples Global Comparison
The core differentiation is methodology consistency.
BaseScore applies the same risk calculation framework globally:
Threat Density: Crime incidents per square kilometer, normalized for population density
Threat Severity: Weighted by crime type (violent crime weighted higher than property crime)
Temporal Patterns: Time-of-day and day-of-week analysis for operational security planning
Trend Analysis: Month-over-month and year-over-year changes to identify risk direction
Geographic Precision: Sub-mile analysis using H3 hexagonal grid for consistent coverage
Every location, whether Chicago, London, São Paulo, or Mumbai, uses this exact same methodology. The BaseScore for your Mumbai office is directly comparable to your Chicago headquarters because the underlying calculation is standardized.
This eliminates the apples-to-oranges problem that breaks manual global monitoring.
Monthly Automated Updates: Always-Current Without Analyst Effort
Traditional security monitoring requires analysts to manually refresh data:
- Log into 25 different municipal websites
- Download new crime reports
- Update spreadsheets
- Recalculate risk scores
- Distribute updated reports
At 500 locations, this consumes weeks of analyst time every quarter.
Base Operations automates security risk assessment data collection for the entire cycle:
- Platform ingests updated data from 25,000+ sources automatically
- BaseScore recalculation happens monthly without analyst involvement
- Change detection identifies significant shifts automatically
- Updated dashboards and reports available immediately
- Exception alerts notify analysts only when action is required
The promise: "Always-current global intelligence without monthly data refresh projects."
REST API Integration: Connect to Regional GSOC/SOC Systems
Enterprise security programs use multiple systems:
- Global Security Operations Centers (GSOC)
- Security Operations Centers (SOC)
- Travel management platforms
- Executive protection tools
- Business intelligence dashboards
Standalone systems create data silos. Analysts copy and paste data between platforms. Critical alerts get missed because information lives in isolated tools.
Base Operations' REST API enables integration:
Example Integration 1: GSOC Dashboard
Daily automated feed → GSOC dashboard
Displays: Global portfolio risk status, highest-risk locations, recent changes
When: Location crosses high-risk threshold
Then: Automated alert to GSOC operators
Example Integration 2: Travel Management
Before: Travel coordinator manually checks security risk for trip destinations
After: Travel booking system queries Base Operations API automatically
Result: Risk assessment included in every travel approval workflow
Benefit: Executive protection becomes proactive, not reactive
Example Integration 3: Real Estate Decision Tools
Before: Real estate selects site, then asks security for assessment (causing delays)
After: Real estate tool queries Base Operations for all candidate sites upfront
Result: Security risk is a factor in site selection from day one
Benefit: Prevents selecting high-risk locations that require expensive mitigation
Integration transforms security intelligence from isolated reports into embedded decision-making across the business.
Multi-Language Interface: Native Workflows for Regional Teams
Global adoption requires global usability.
Your São Paulo security analyst shouldn't need to work in English. Your Tokyo GSOC operator shouldn't translate interface text. Regional teams need native-language workflows.
Base Operations supports:
- Multi-language interface (English, Spanish, Portuguese, French, German, Japanese)
- Localized date/time formats (DD/MM/YYYY vs MM/DD/YYYY)
- Regional numbering conventions (1,000 vs 1.000)
- Cultural adaptations for threat visualization
- Documentation in regional languages
This matters for adoption. When regional teams can work in their native language, they actually use the platform instead of requesting translated reports from headquarters.
Global Coverage Map: Proof of Capability
Vendors claim global coverage. Base Operations proves it.
Coverage Validation:
- Browse 5,000+ cities across all continents
- Filter by country or region to see specific coverage
- Verify data sources for any location
- Review BaseScore methodology application
- Test coverage for your specific footprint
This transparency eliminates "trust us, we have global coverage" promises that collapse when you need obscure cities in emerging markets.
Implementation Roadmap: From Regional to Global in 90 Days
Theory is valuable. Implementation is what matters.
This roadmap shows the specific steps to transform from regional reactive security operations to global proactive intelligence monitoring in 90 days.
Phase 1: Foundation (Weeks 1-2)
Week 1: Global Footprint Mapping
Objective: Catalog every location requiring security monitoring
Activities:
1. Current Location Inventory
- List all existing facilities globally
- Document addresses and coordinates
- Identify facility types (office, warehouse, retail, etc.)
- Note any locations with existing security incidents
2. Planned Expansion Sites
- Real estate pipeline for next 12 months
- M&A targets with location footprints
- Temporary locations (event spaces, pop-up operations)
3. Coverage Gap Analysis
- Which locations currently have regular security assessments?
- Which are monitored only when incidents occur?
- Which have never been formally assessed?
Deliverable: Comprehensive location database (typically 100-1,000+ locations for global enterprises)
Week 2: Technology Assessment and Team Capability Inventory
Objective: Understand current tools and team structure
Activities:
1. Current Technology Audit
- What tools currently used for risk monitoring?
- What data sources accessed manually?
- What integration requirements exist (GSOC, SOC, travel management)?
- What reporting workflows are established?
2. Team Capability Mapping
- How many analysts currently work on security monitoring?
- What percentage of time spent on data collection vs. analysis?
- What regional expertise exists (languages, local knowledge)?
- Who are potential regional SMEs for validation?
3. Stakeholder Requirements
- What do executives expect from global security monitoring?
- What are real estate team needs for site assessments?
- What are travel management requirements for duty-of-care?
- What are board-level reporting requirements?
Deliverable: Requirements document defining success criteria and integration needs
Phase 2: Deployment (Weeks 3-4)
Week 3: Platform Deployment and Global Coverage Activation
Objective: Go live with automated global monitoring
Activities:
1. Platform Provisioning
- SSO integration with corporate directory
- User access for security team members
- API keys for system integrations
- Multi-language interface configuration
2. Location Portfolio Upload
- Bulk upload all locations (addresses or coordinates)
- Verify location matching and coverage
- Configure monitoring radiuses (typically 0.5-1 mile)
- Set up location hierarchies (regions, countries, business units)
3. Initial Risk Baseline Generation
- Platform calculates BaseScore for all locations
- Generate global risk ranking
- Identify highest-risk locations requiring immediate attention
- Create baseline for future change detection
Deliverable: Fully operational platform with complete global portfolio monitored
Week 4: Process Standardization and Analyst Training
Objective: Establish workflows and train team
Activities:
1. Exception-Based Monitoring Workflow
- Define exception thresholds (e.g., 20% monthly change)
- Create escalation protocols (regional SME, executive notification)
- Document response procedures for high-risk alerts
- Establish regional validation workflows
2. Analyst Training
- Platform navigation and feature usage
- Interpreting BaseScore and threat breakdowns
- Exception-based monitoring discipline
- Regional validation protocols
- Report generation and stakeholder communication
3. Integration Testing
- Validate API connections to GSOC/SOC systems
- Test automated alerting workflows via API
- Verify executive dashboard updates
- Confirm report distribution processes
Deliverable: Trained team with documented workflows and operating procedures
Phase 3: Regional Rollout and Validation (Weeks 5-8)
Week 5-6: Phased Regional Deployment
Objective: Roll out by geography with regional validation
Approach: Deploy in phases to validate methodology before full global operation
Phase 1: Home Market Validation (Week 5)
- Start with region you know best (typically North America for US companies)
- Validate that automated BaseScore matches your existing understanding
- Identify any methodology adjustments needed
- Document successful validation process for other regions
Phase 2: Established Markets (Week 6)
- Deploy to regions with existing security presence (typically Europe)
- Engage regional security personnel for validation
- Confirm methodology translates across different jurisdictions
- Identify any cultural or regulatory considerations
Week 7-8: Emerging Markets and Integration
Phase 3: High-Growth Markets (Week 7)
- Deploy to expansion regions (Latin America, Asia-Pacific)
- Engage regional SMEs for local validation
- Document any data availability limitations
- Establish regional monitoring protocols
Platform Integration (Week 8)
- Connect to existing GSOC/SOC dashboards
- Integrate with travel management systems
- Link to real estate site selection tools
- Configure executive briefing templates
Deliverable: Full global coverage with regional validation completed
Phase 4: Optimization and Measurement (Weeks 9-12)
Week 9-10: Alert Threshold Optimization
Objective: Refine exception thresholds based on real data
Activities:
1. Analyze First Month Operations
- How many exception alerts triggered?
- Were thresholds too sensitive (too many alerts) or too conservative (missed significant changes)?
- Which alert types were most actionable?
- Where did regional validation add critical context?
2. Threshold Calibration
- Adjust percentage-change thresholds for different regions
- Refine high-risk classification criteria
- Configure threat-type-specific alerts (e.g., violent crime vs. property crime)
- Establish temporal alert rules (e.g., suppress routine seasonal variations)
3. Regional SME Workflow Optimization
- Which locations consistently require regional validation?
- Where can automated intelligence stand alone?
- How can regional expert time be used most efficiently?
Deliverable: Optimized alert configuration reducing noise and focusing on actionable intelligence
Week 11: Expansion Planning and Strategic Portfolio Review
Objective: Use global intelligence for strategic planning
Activities:
1. Portfolio Risk Assessment
- Identify highest-risk locations requiring security investment
- Analyze regional risk patterns informing expansion strategy
- Document locations where risk decreased (enabling resource reallocation)
2. Real Estate Pipeline Integration
- Assess security risk for all planned expansion sites
- Provide data-backed recommendations for site selection
- Identify locations where security risk should influence decision
3. Executive Briefing Preparation
- Compile global portfolio risk summary
- Document significant risk changes over past 90 days
- Prepare strategic recommendations for security investments
- Quantify efficiency gains from automated monitoring
Deliverable: First comprehensive global security briefing for executive leadership
Week 12: Measurement and Continuous Improvement
Objective: Document results and establish ongoing optimization
Activities:
1. Metrics Documentation
- Location coverage achieved (target: 100% of global footprint)
- Analyst time savings (benchmark: 50-70% reduction in data collection)
- Update frequency improvement (quarterly → monthly)
- Strategic bandwidth recovery (% time on strategic vs. operational work)
2. Stakeholder Feedback
- Executive satisfaction with global risk visibility
- Real estate team feedback on site assessment speed
- Regional security personnel input on intelligence quality
- GSOC/SOC integration effectiveness
3. Continuous Improvement Plan
- Quarterly alert threshold reviews
- Bi-annual methodology validation with regional SMEs
- Annual expansion coverage review (new markets, data sources)
- Ongoing integration opportunities (additional systems, workflows)
Deliverable: 90-day transformation results and continuous improvement framework
Success Metrics: What Good Looks Like
After 90 days, successful implementations show:
Coverage Metrics:
- 95% of global locations monitored with standardized methodology
- Monthly updates (vs. quarterly or ad-hoc previously)
- Exception alerts surfacing 5-10% of locations requiring analyst attention
Efficiency Metrics:
- 50-70% reduction in analyst time spent on data collection
- 3-5x increase in strategic work bandwidth
- 4-10x improvement in location-to-analyst ratio
Quality Metrics:
- Standardized risk scoring enabling objective location comparison
- Proactive risk identification before incidents occur
- Executive briefings with quantified global risk intelligence
Business Impact Metrics:
- Faster real estate site assessments (weeks → days)
- Proactive executive protection for international travel
- Data-backed security budget requests (vs. incident-driven)
Conclusion: From Regional Reactive to Global Proactive Security
The transformation from regional reactive security operations to global proactive intelligence programs isn't just about technology. It's about fundamentally reconceptualizing what security monitoring can be when you eliminate the constraints that manual processes impose.
At 50 locations, manual monitoring is manageable. Analysts can research local crime patterns, build custom risk assessments, and maintain personal relationships with each site's security contacts.
At 500 locations, that approach collapses. You can't scale analyst headcount proportionally. You can't maintain consistency across 30 countries with 15 different analysts using 15 different methodologies. You can't be proactive when 100% of your bandwidth is consumed by data collection.
The security leaders who succeed at global scale recognize this inflection point and make the transformation:
From Manual to Automated: Stop asking analysts to manually collect data from 25,000 sources. Automate data collection and normalization. Redirect analyst bandwidth to interpretation, validation, and strategic work.
From Reactive to Proactive: Stop waiting for incidents to trigger risk assessments. Implement continuous monitoring with exception-based alerts that surface significant changes before they become crises.
From Inconsistent to Standardized: Stop accepting that "every country is different" as justification for incomparable risk assessments. Apply globally consistent methodology while layering regional expertise for local context.
From Analyst Bandwidth Drain to Force Multiplier: Stop scaling headcount proportionally to location growth. Deploy technology infrastructure that enables 100:1 or 200:1 location-to-analyst ratios.
From Cost Center to Strategic Enabler: Stop positioning security as pure defense and compliance overhead. Demonstrate value by enabling faster real estate decisions, proactive executive protection, and data-backed resource allocation.
The customers we've profiled in this playbook made this transformation:
- A global 3PL scaled from 50:1 to 200:1 location-to-analyst ratios, monitoring 441 cities with a team of 2
- A Top 25 retailer achieved 70% time reduction monitoring 8,500+ sites with standardized methodology
- A global consultancy improved efficiency 35% while doubling real estate support capacity
These aren't incremental improvements. These are 4x capacity increases, 70% time reductions, and fundamental shifts in how security programs operate.
Your inflection point is coming—if it hasn't arrived already. Executive stakeholders will demand global visibility. Real estate will accelerate expansion into new markets. M&A will add 300 locations overnight. The question isn't whether you'll need to scale globally. The question is whether you'll scale with manual processes that collapse under pressure or with force multiplier infrastructure that enables strategic security operations.
The 90-day roadmap exists. The technology infrastructure is proven. The transformation is possible.
The only question: When will you start?
Frequently Asked Questions
How quickly can we deploy global security monitoring across hundreds of locations?
Base Operations deploys in 90 days from contract to full global coverage. Month 1 focuses on platform deployment and location mapping. Month 2 covers analyst training and process standardization. Month 3 implements phased regional rollout. The platform comes pre-configured with 5,000+ cities globally, eliminating months of manual setup work that traditional approaches require.
Can a small security team really monitor hundreds of global locations?
Yes, through the force multiplier approach. Base Operations automates baseline monitoring for all locations with standardized BaseScore methodology, then uses exception-based alerts to focus analyst attention only on significant changes. A Global 3PL monitors 441 cities with a team of 2. A Fortune 500 retailer covers 8,500+ sites with 70% less analyst time. The key is automation for breadth, analysts for strategic depth.
How do you maintain consistent risk assessment across different countries with different data standards?
Base Operations solves the multi-jurisdiction standardization problem with: (1) Unified risk ontology—BaseScore methodology applies the same framework across 150+ countries; (2) H3 grid system for consistent geographic coverage worldwide; (3) Standardized threat taxonomy mapping local incident types to global categories; (4) Automated data normalization from 25,000+ sources using consistent methodology. This enables true apples-to-apples comparison between Mexico City, São Paulo, Singapore, and any other global location.
What's the difference between centralized, hub-and-spoke, and federated global security monitoring models?
Centralized (single global team with unified platform) delivers maximum consistency and efficiency but may lack local context. Hub-and-Spoke (regional centers coordinating with central team) balances standardization with regional expertise. Federated (regional autonomy with shared platform) provides flexibility but risks inconsistency. Base Operations recommends centralized platform + regional expertise overlay: automated global baseline monitoring with local analysts validating high-risk alerts when needed. This combines scale efficiency with contextual intelligence.
Takeaways

Join 1100+ security leaders getting new ideas on how to better protect their people and assets.