Automated monthly branch risk monitoring across a location footprint
Automate a monthly risk pull across your entire branch footprint into your BI dashboard. Deliver Base Score and subcategory data, segmented by time of day, to every branch manager with no manual collection.


Use Case Overview
Automated monthly branch risk monitoring across a location footprint
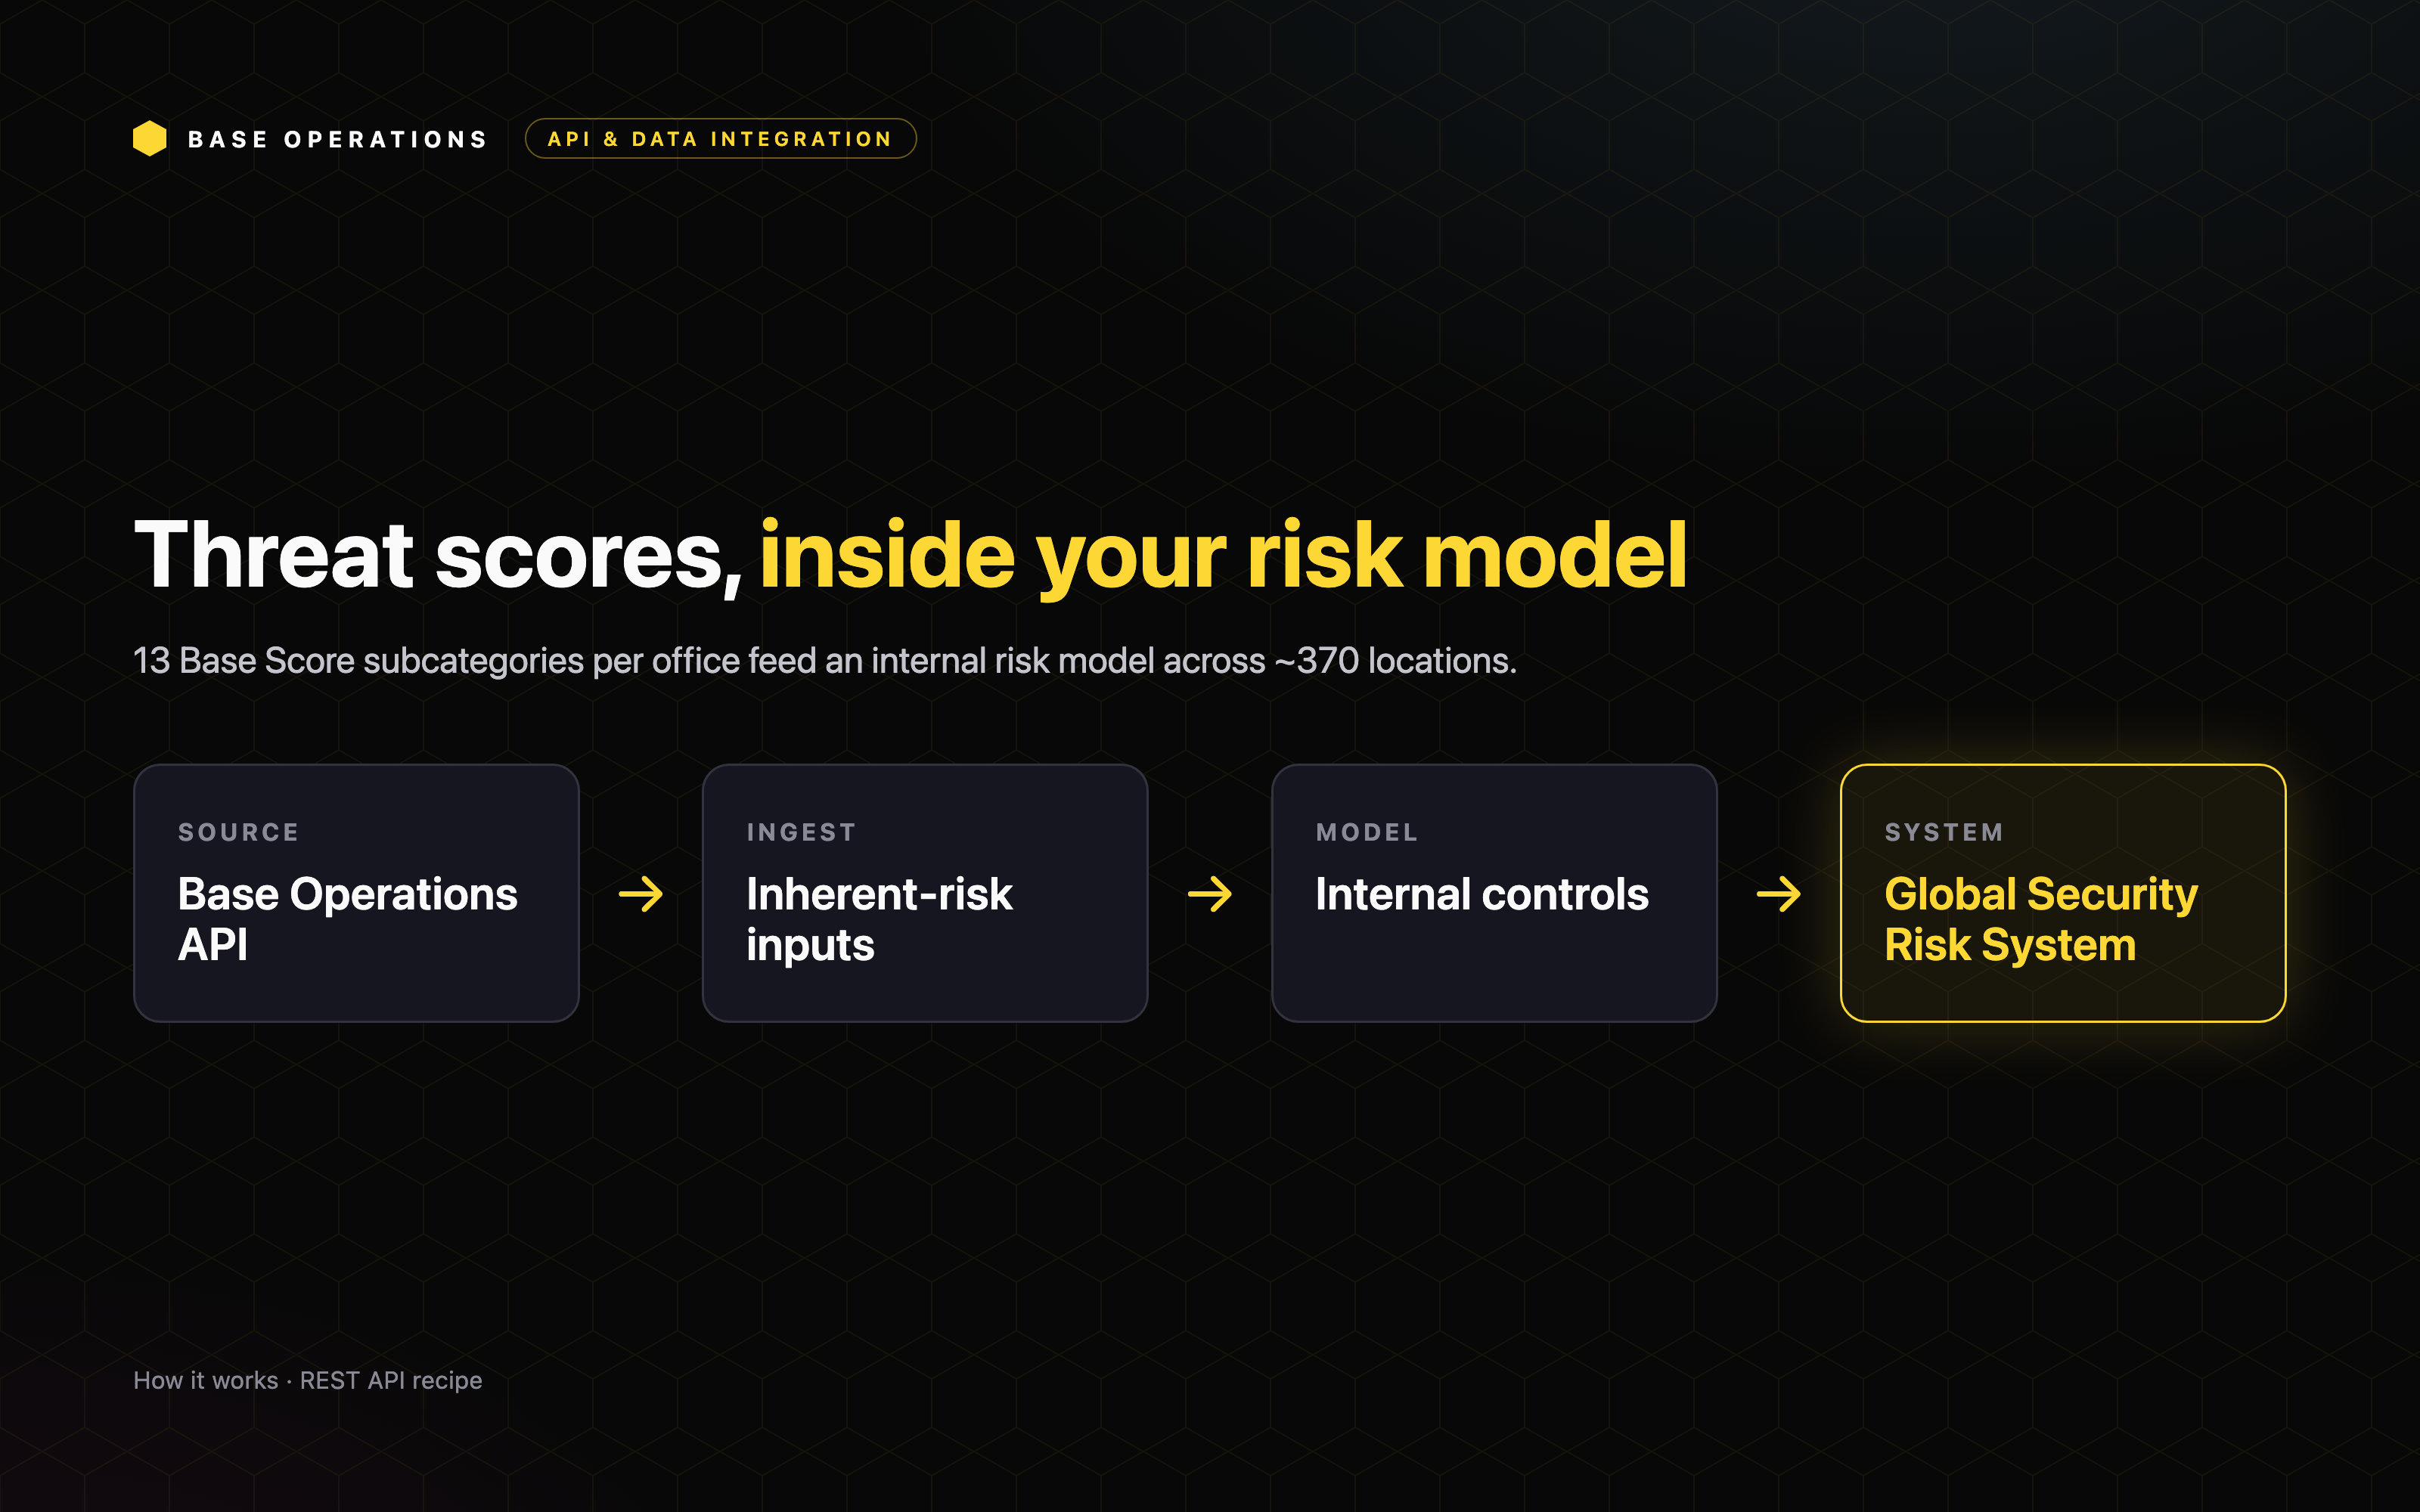
Base Operations delivers branch-level risk through a REST API, so a single security manager can monitor an entire footprint on a schedule instead of by hand. A regional credit union covers 23 branches with a security team of one, and a monthly API pull refreshes Base Score and subcategory data for every branch into Power BI. This use case shows how to move a security team's time from collecting and formatting data to acting on it.
Who Benefits
This use case is valuable for Security Managers and Corporate Security leaders responsible for a multi-site footprint, Branch and Facilities Managers who need a clear read on local risk, and lean security teams that cannot cover every site by hand. It's especially relevant for financial services institutions, credit unions, and any organization managing risk across many branches or locations.
Protection Impact
Giving every branch manager a current, sourced read on local crime replaces gut feel with fact. Segmenting that data by time of day, business hours versus overnight, lets each branch match staffing and safety measures to when risk is actually highest, so protection is in place before incidents occur.
Operational Improvements
Traditional branch monitoring depends on manual data collection that a small team can only do occasionally, if at all. Base Operations transforms this approach by providing:
- A single scheduled pull that covers the entire footprint every month
- Base Score plus subcategory scores for each branch, refreshed in place
- Time-of-day segmentation that grounds staffing conversations in fact
- Reporting each branch manager can read without a security background
Use Case Walkthrough
Automation removes the manual data work. What used to be a monthly scramble is now a job that runs itself and lands in a dashboard every branch manager can read.
Step 1: Pull every branch
Each month, the API returns Base Score and subcategory scores for all 23 branches, with no manual collection.
Step 2: Run it on a schedule
The pull runs automatically, and results refresh in place every cycle.
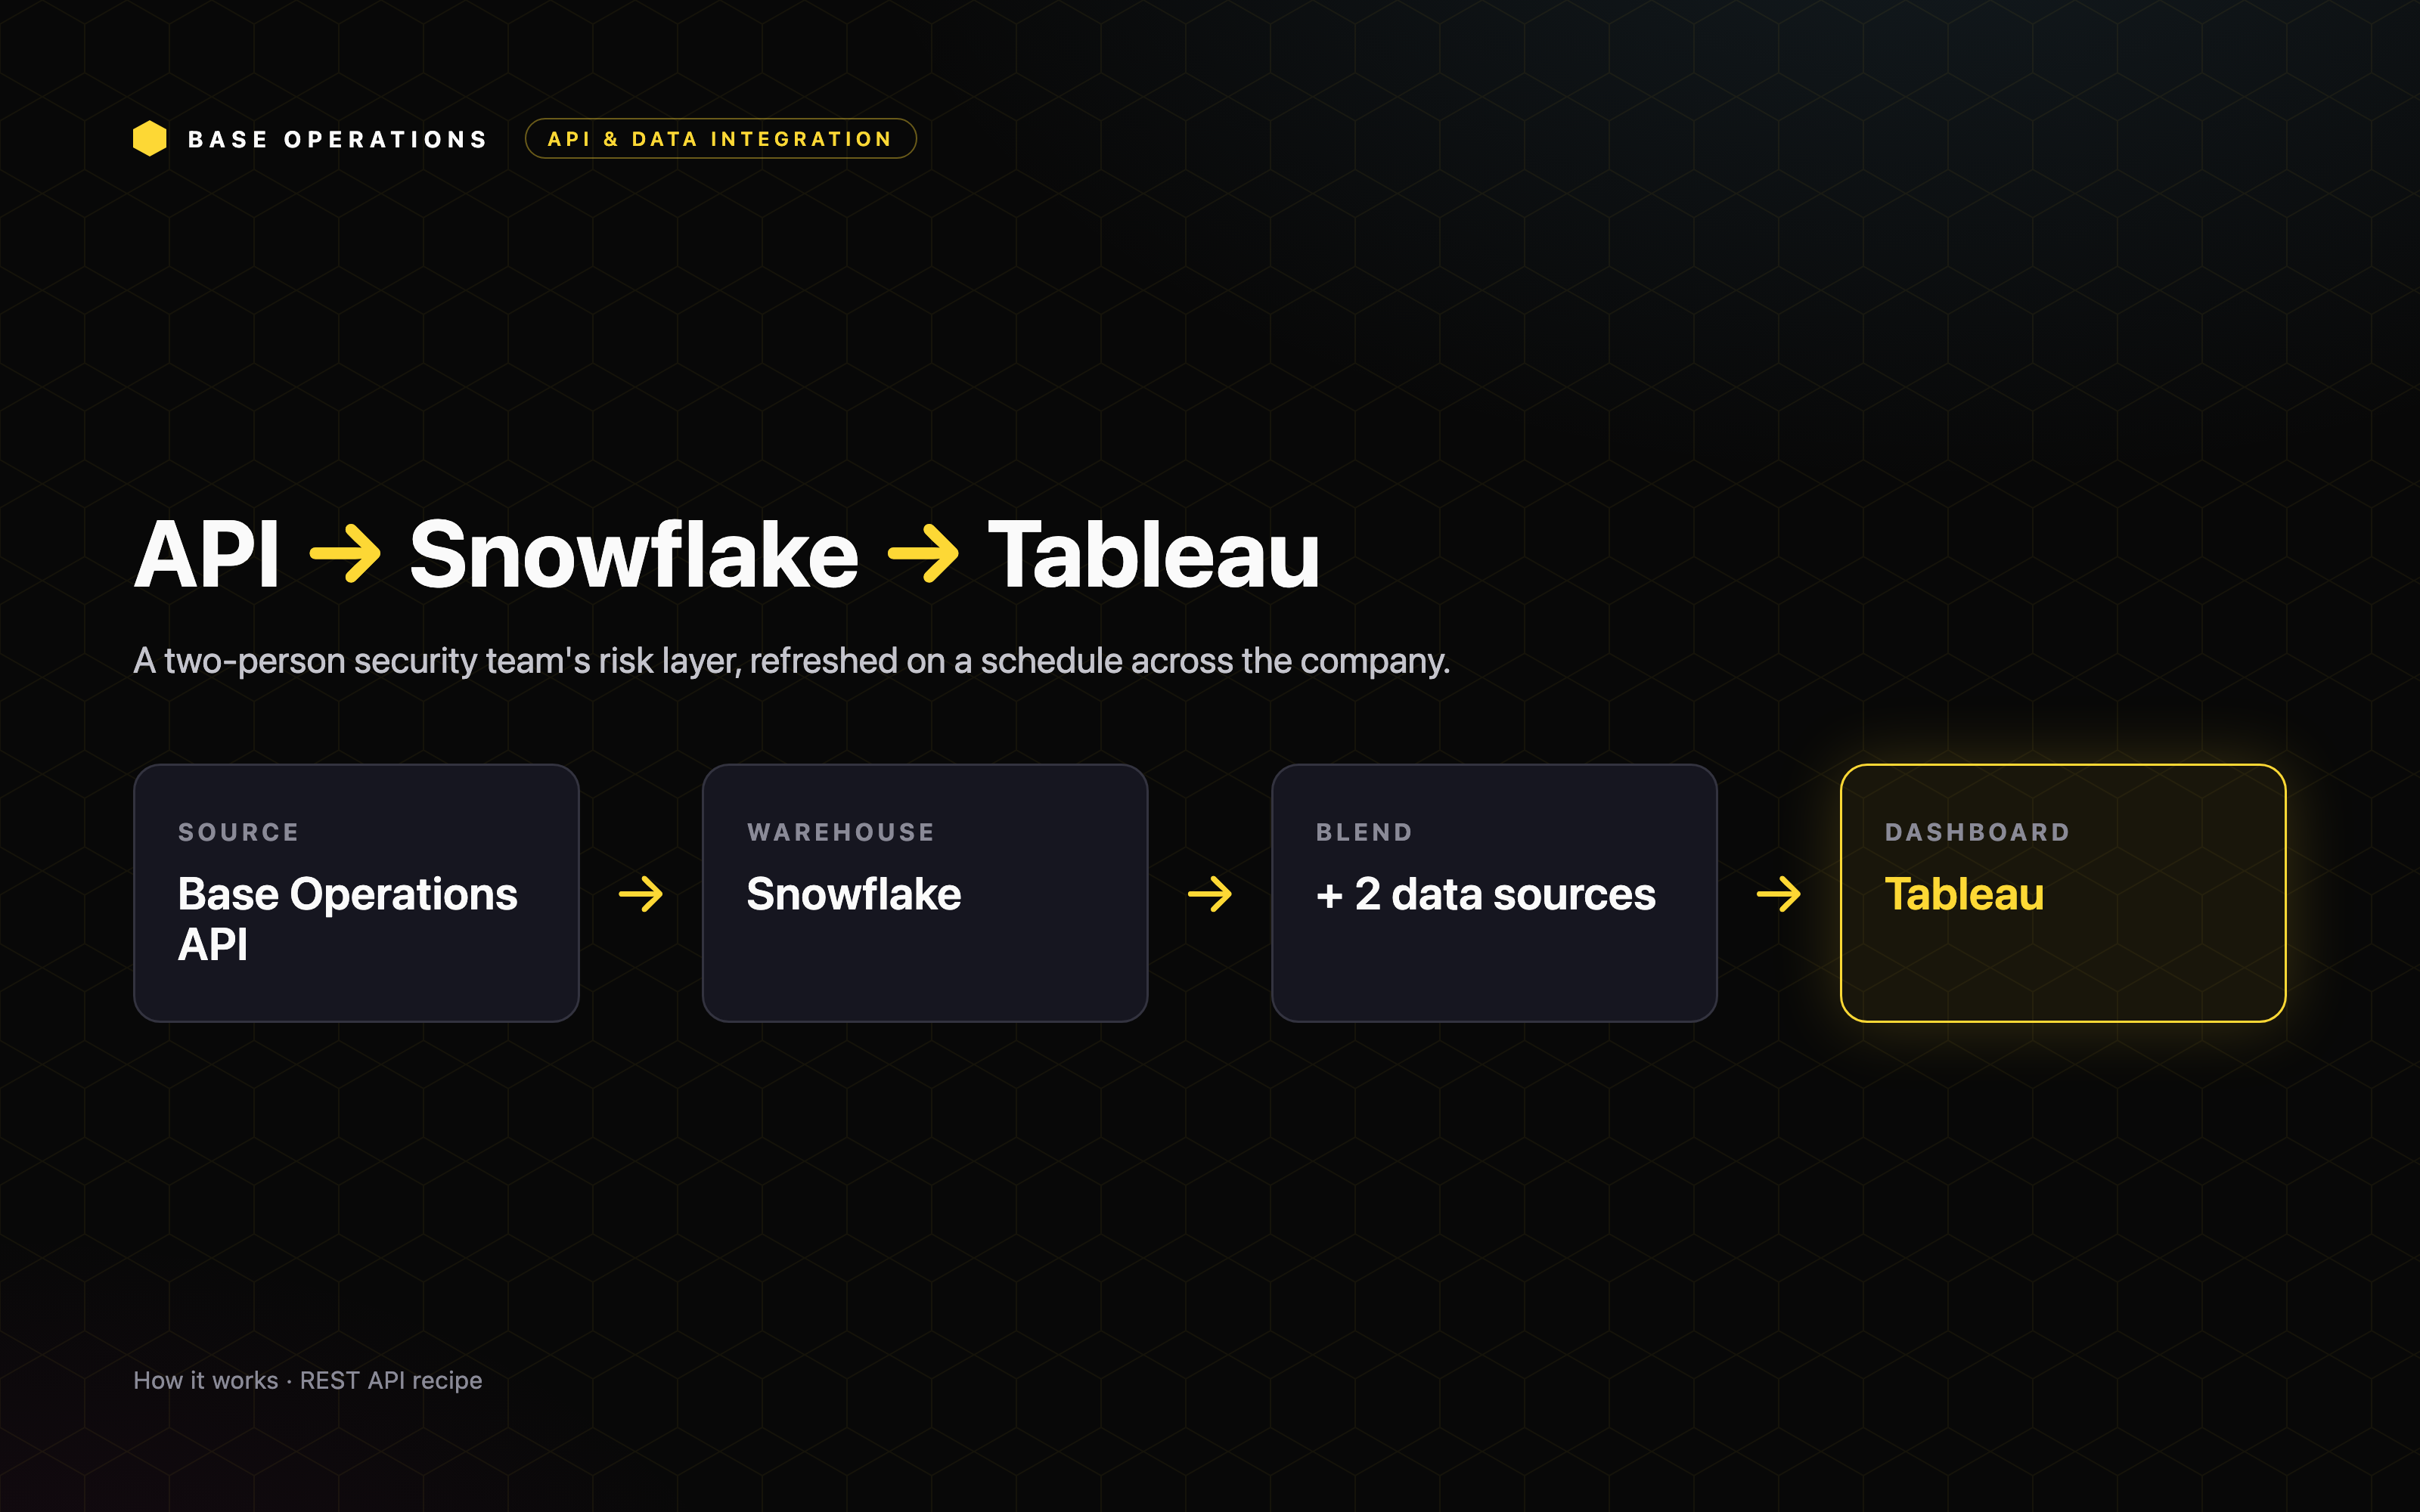
Step 3: Land it in the dashboard
Everything lands in an internal Power BI dashboard.
Step 4: Deliver to branch managers
Crime data goes to all 23 branch managers monthly, segmented by time of day, business hours versus overnight, so staffing conversations start from a factual baseline.
The endpoints behind it
What comes back
Each branch returns a composite Base Score plus a Base Score for every crime subcategory beneath it. Put in front of a branch manager, those subcategory scores replace "I feel like it's gotten worse lately" with a specific, sourced picture of what is actually happening around the branch.
Conclusion
API automation removes the manual data work, and that is what changes the job. One analyst now covers a full branch footprint at a cadence that would have been impossible by hand, with time freed for analysis and action. The same program also feeds new-branch site selection, CEO travel briefings, and ATM fraud context.
This is the shift from reactive to proactive. Risk data arrives on its own, reaches the people closest to each location, and turns a monthly scramble into a standing view every branch can act on.