Embedding location risk in a data warehouse and BI dashboard
Route the Base Operations API into your data warehouse and surface location risk in the BI tools your teams already use. Blend Base Score and month-over-month change with your internal data for a company-wide risk layer that refreshes on its own.

Use Case Overview
Embedding location risk in a data warehouse and BI dashboard
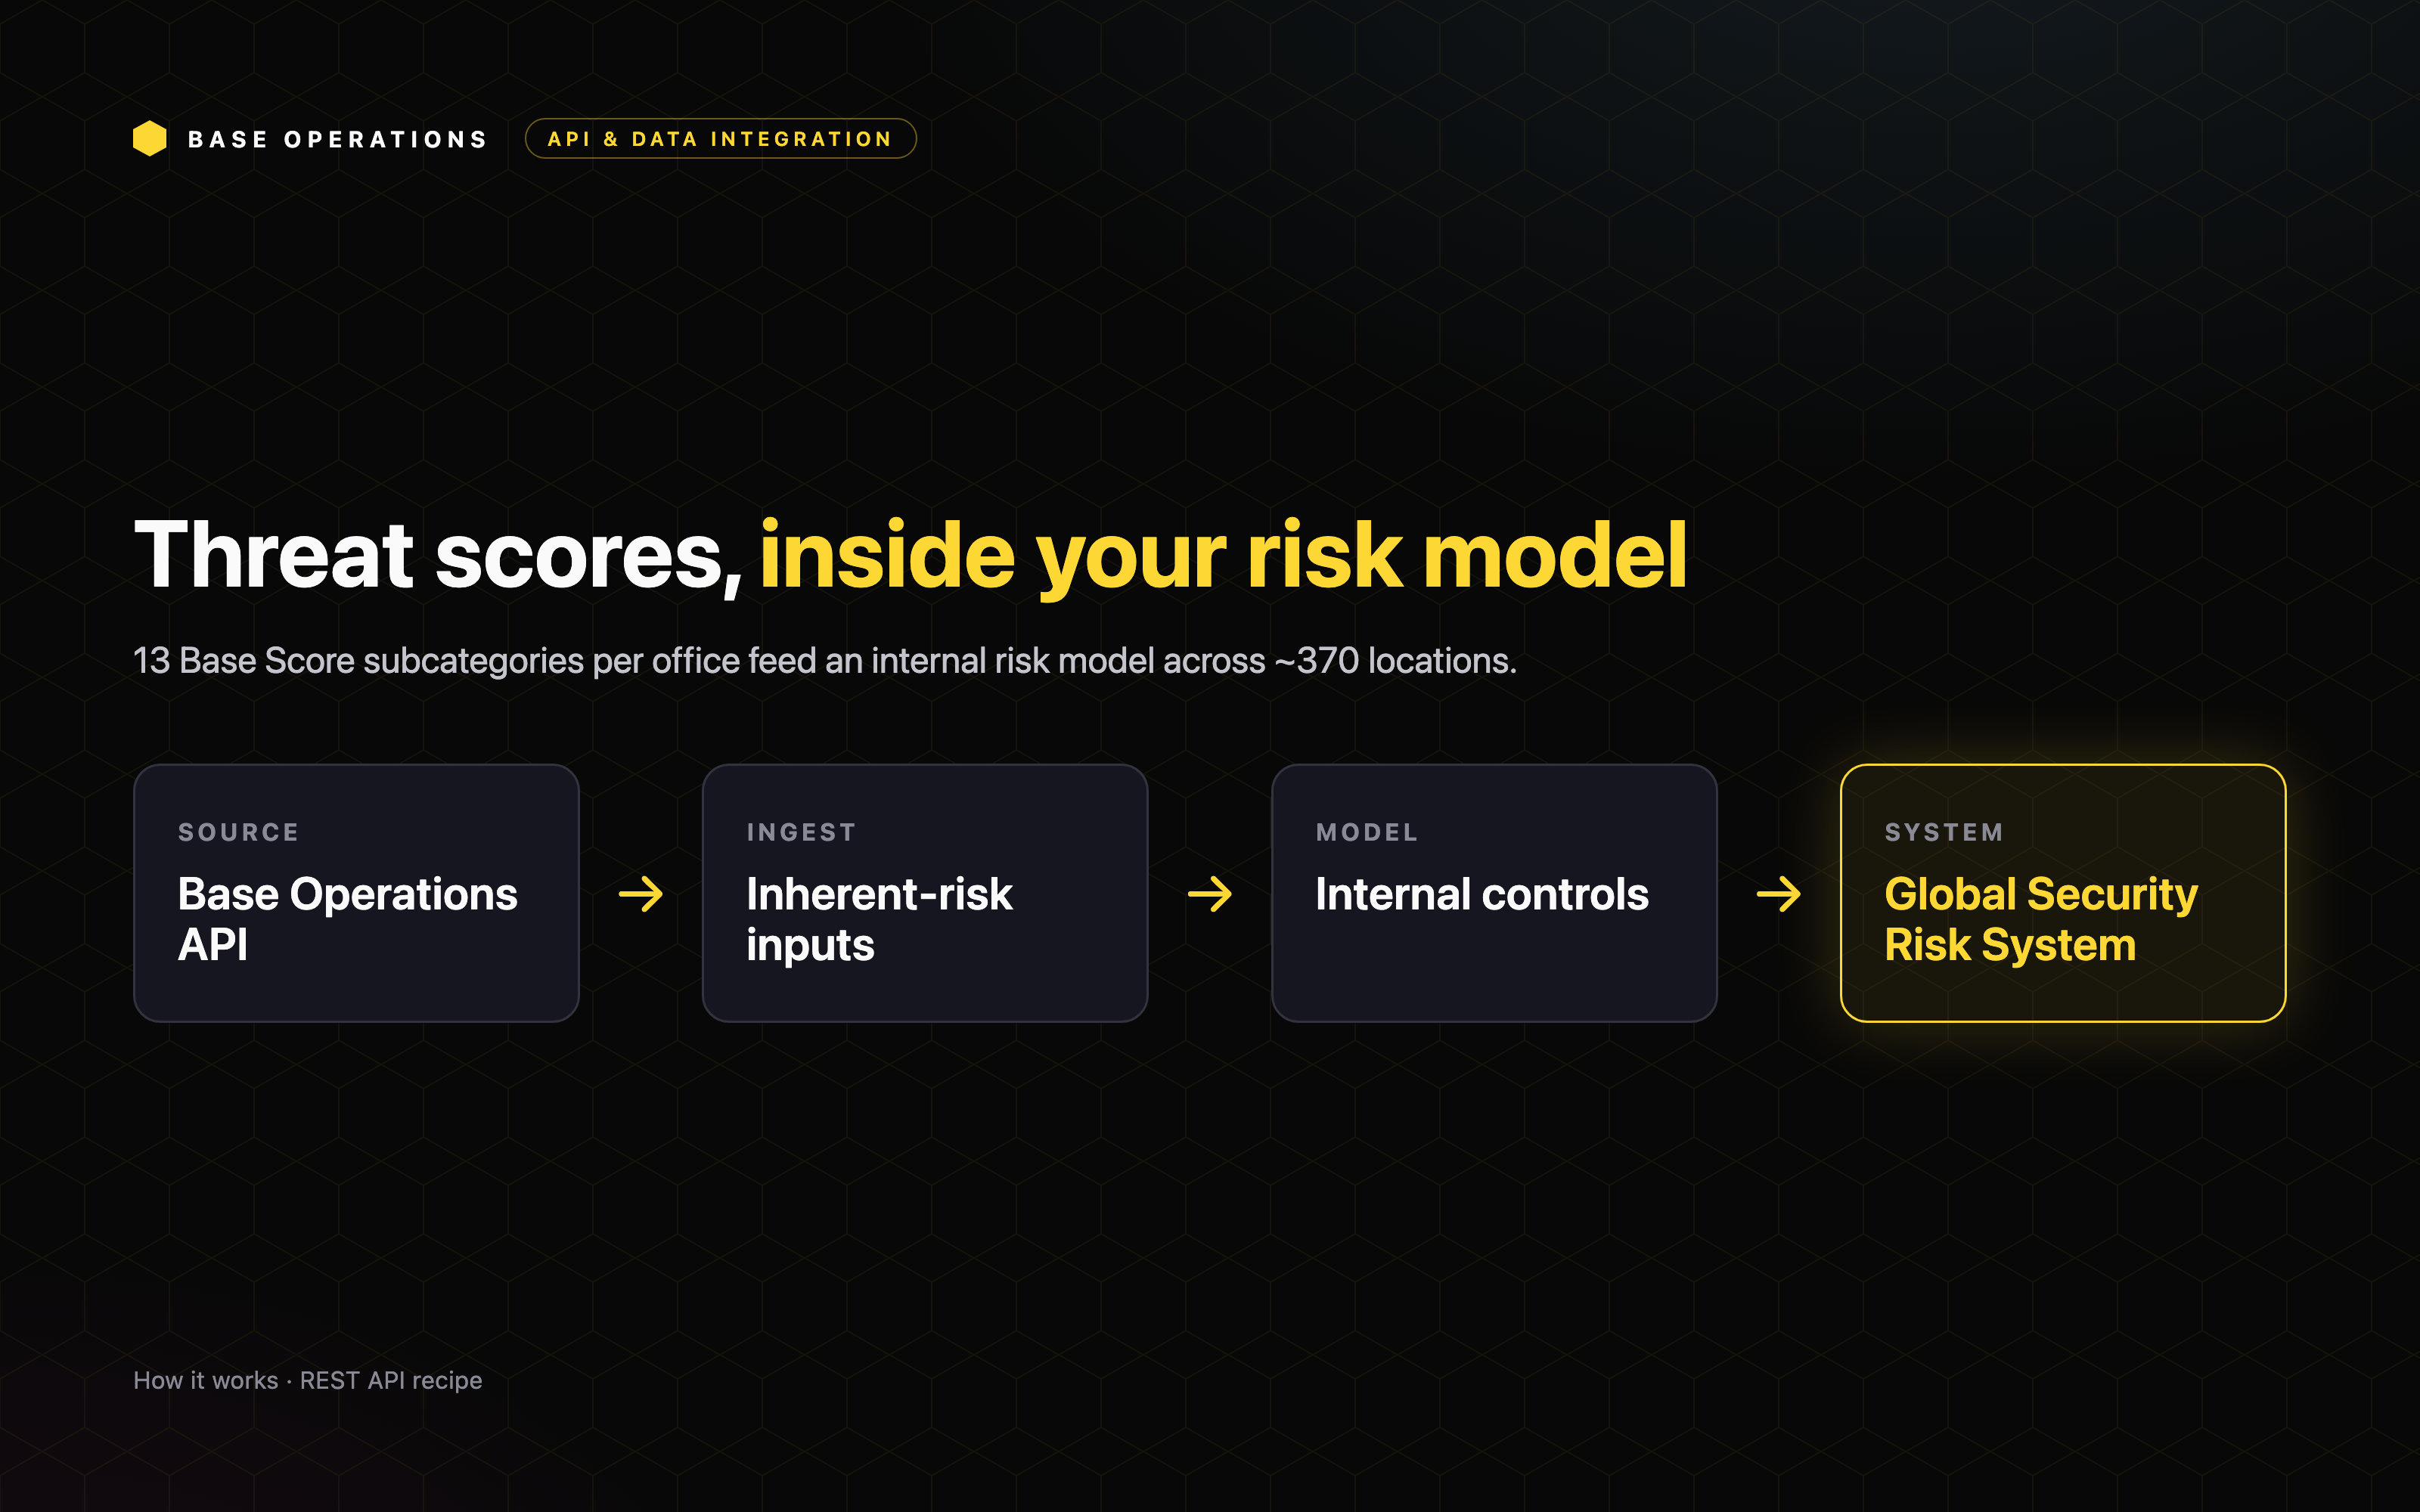
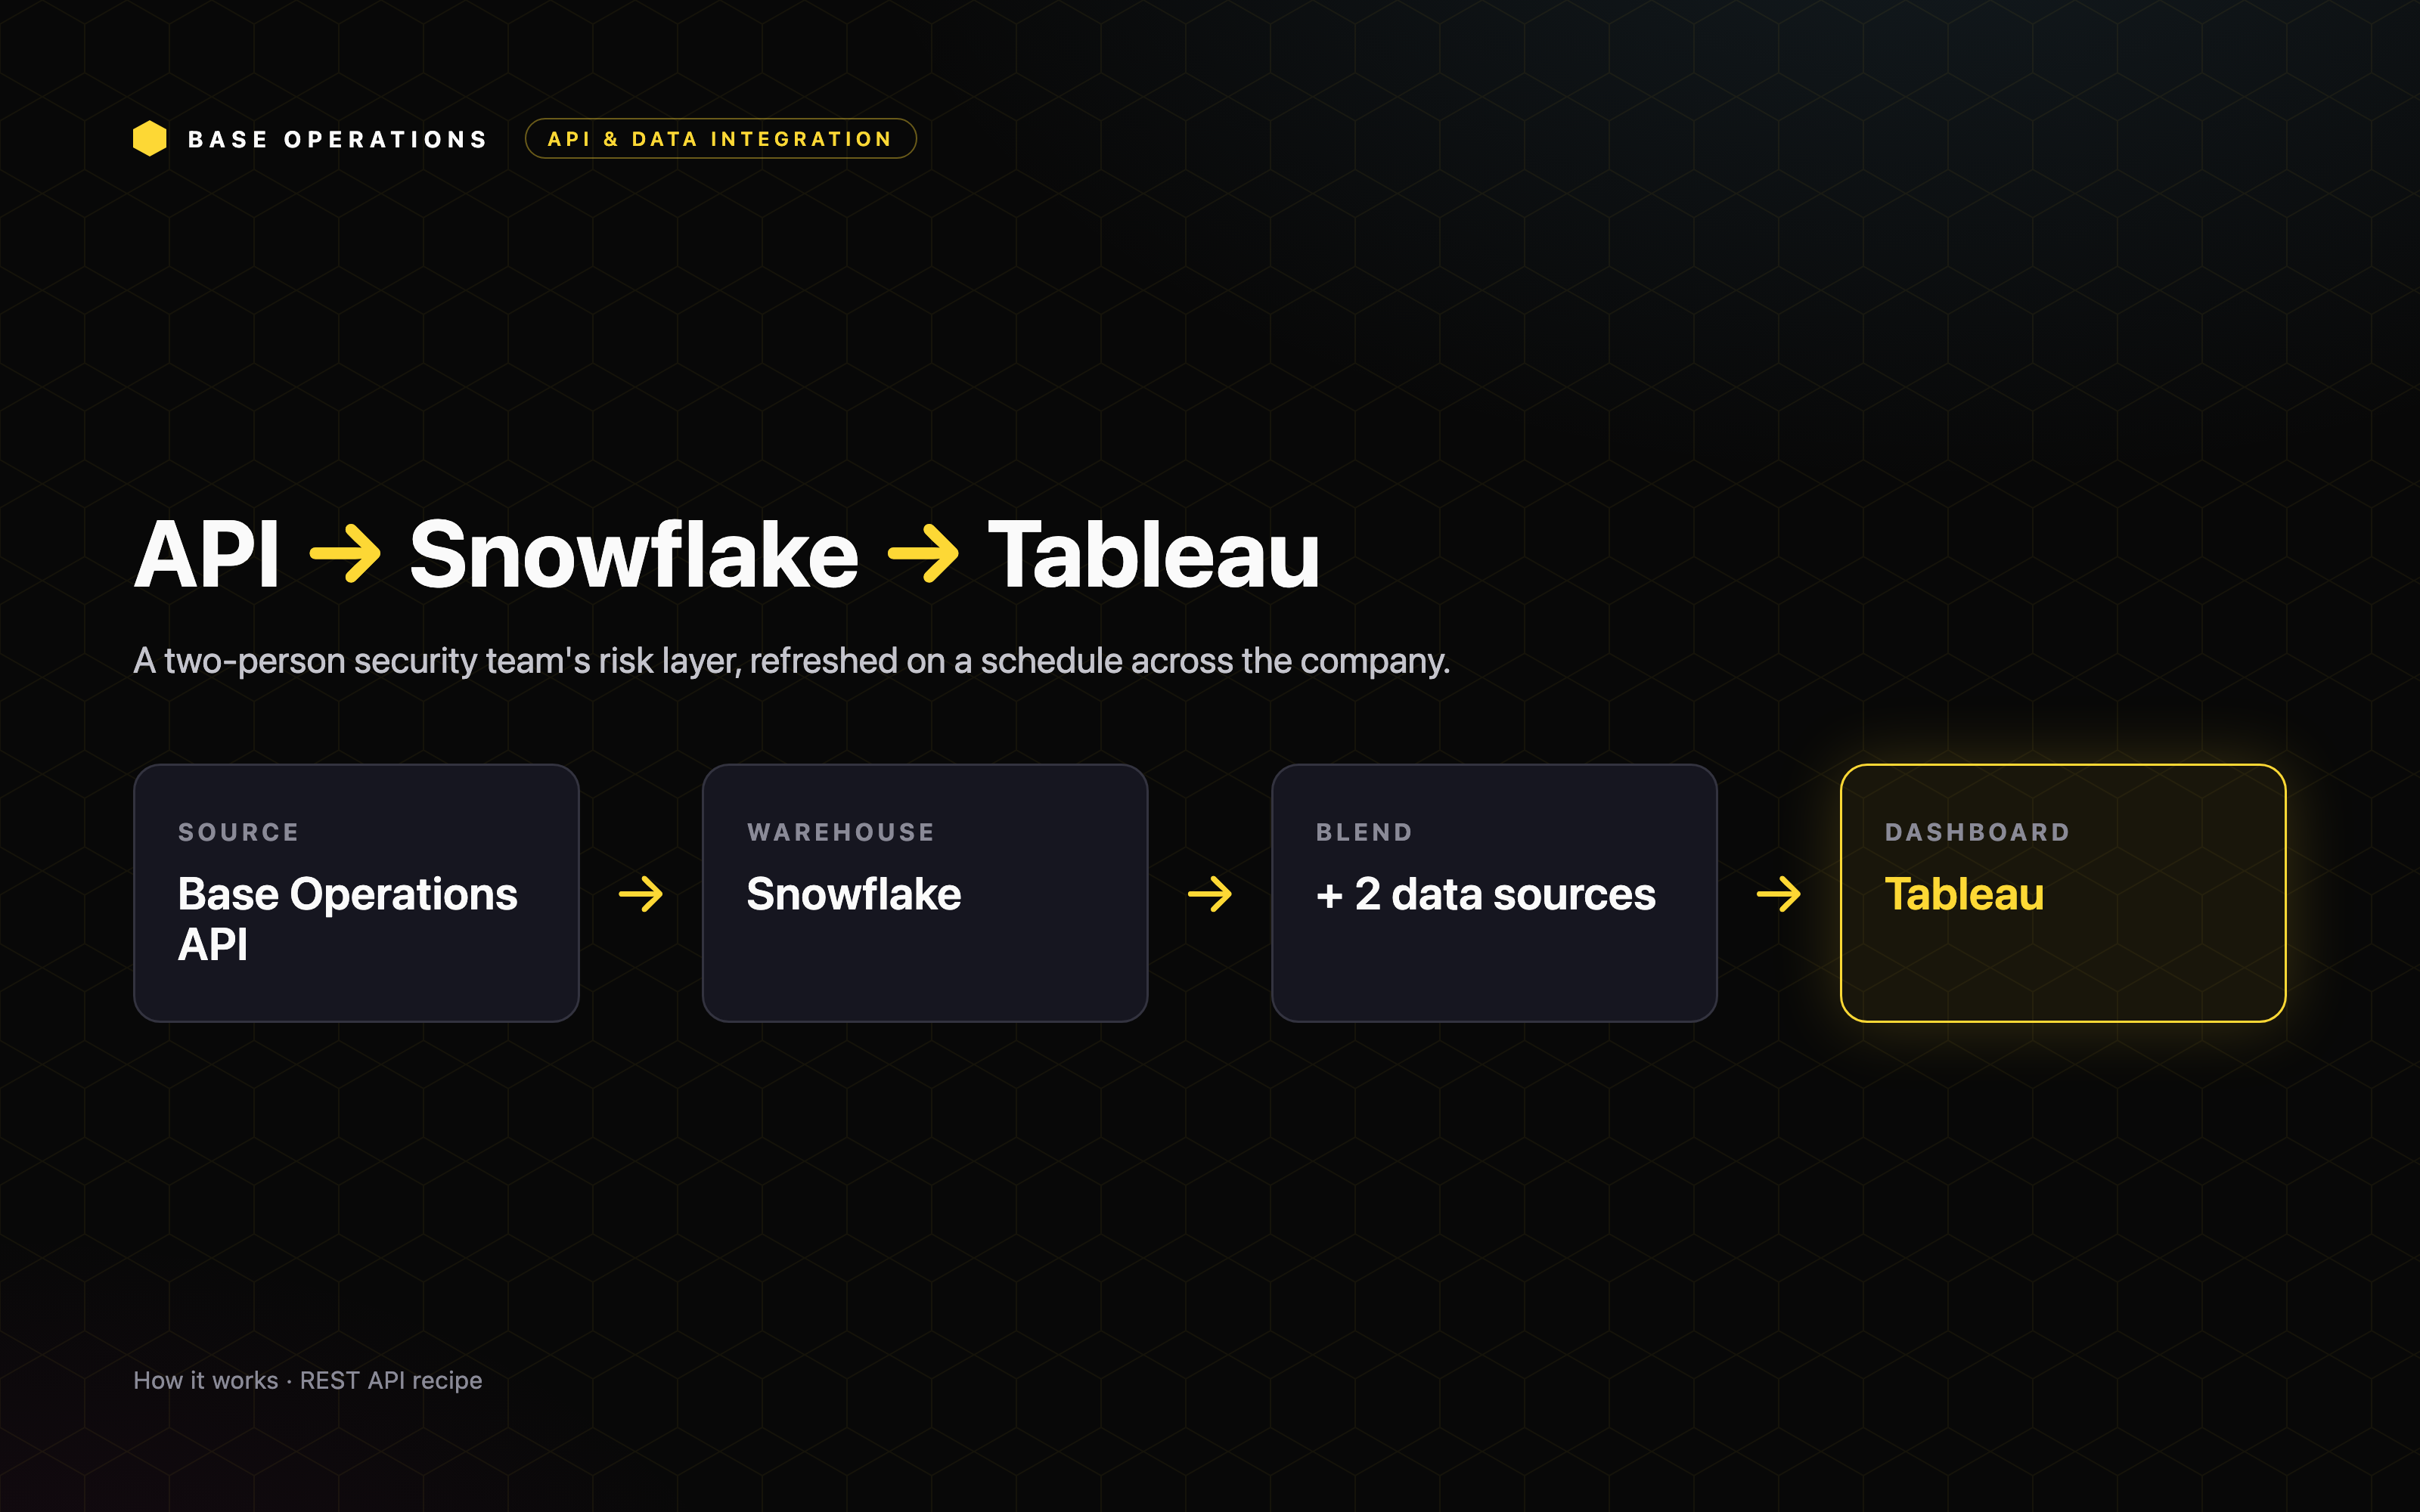
Base Operations delivers location risk through a REST API, so security teams can treat it as one more dataset in the company's existing data stack rather than a separate tool to stand up. A global social media and technology platform runs corporate security with a team of two, so they routed the API into Snowflake and surfaced it in Tableau. This use case shows how to blend Base Score and month-over-month change with internal data for a company-wide risk layer that refreshes on a schedule.
Who Benefits
This use case is valuable for Security Directors and Corporate Security leaders who want risk data inside the systems the business already runs, Security Data and Analytics teams maintaining a warehouse and BI stack, and lean security teams that need enterprise reach without added headcount. It's especially relevant for technology companies, financial services firms, and any enterprise that already operates a central data warehouse and BI platform.
Protection Impact
Surfacing location risk in the same dashboards the business already reads keeps security, real estate, and operations working from one shared picture. Tracking how each site's risk moves month over month lets teams catch deterioration early and focus attention on the locations that are changing, before those shifts turn into incidents.
Operational Improvements
Traditional security programs often stand up a separate tool for location risk, which adds cost, another login, and a dataset no one else in the company can see. Base Operations transforms this approach by providing:
- API delivery that lands risk data directly in your existing warehouse
- A month-over-month change metric that tracks movement against each site's own baseline
- A shared layer that security, real estate, and operations all read from
- Automatic scheduled refreshes that need no manual upkeep
Use Case Walkthrough
The insight here is that Base Operations data behaves like any other enterprise dataset. Once it lands in the warehouse, a two-person security team gets the leverage of the company's entire BI platform.
Step 1: Pull on a schedule
A scheduled job calls the API for each site, returning the Base Score plus the month-over-month change metric.
Step 2: Land it in the warehouse
Results land in Snowflake, the company's central data warehouse, as a time series.
Step 3: Blend with internal data
In the warehouse, Base Operations sits alongside two other sources: a POI and access-control platform for site-compliance scoring, and internal incident data from company systems.
Step 4: Surface it in BI
Tableau renders the combined layer. Both the security team and the real estate team read from the same dashboard. It has been live since Q1 2026.
The endpoints behind it
What comes back
The point-in-time Base Score gives you context, and the month-over-month change metric gives you the signal. This team tracks movement: how each location's risk shifts against its own baseline, month over month.
Conclusion
A two-person team built an enterprise-scale risk layer that refreshes automatically, by routing Base Operations through the same infrastructure the whole company already runs on. For lean teams, that is the API's real unlock: reach that used to require headcount now comes from a scheduled query.
This is the shift from reactive to proactive. Location risk lives in the systems the business already uses, updates on its own, and gives every team one shared, current view to act on.