Fleet-wide store risk scoring as a native GIS map layer
Score your entire store fleet through the Base Operations API and surface it as a native layer in your GIS environment. A single script classifies every store by Base Score and crime subcategories, turning thousands of addresses into a live, queryable risk map.


Use Case Overview
Fleet-wide store risk scoring as a native GIS map layer
Base Operations delivers store-level risk through a REST API, so a retailer can score an entire fleet with a single script and map it in the GIS tools its teams already use. A national mass-market retailer needed one consistent risk read across roughly 9,200 stores, so it replaced a legacy crime-score provider with the Base Operations API and surfaced the results in Esri ArcGIS Enterprise. This use case shows how to turn thousands of store addresses into a live, queryable risk layer.
Who Benefits
This use case is valuable for Corporate Security and Asset Protection leaders managing risk across a large store fleet, GIS and Site-Selection teams who plan around location risk, and Security Analysts who need a consistent score for every site. It's especially relevant for retailers, restaurant and hospitality chains, and any organization operating hundreds or thousands of physical locations.
Protection Impact
A consistent risk score for every store, broken down by crime subcategory, shows exactly where protection is needed and why. Because a composite score can mask a specific threat, the subcategory detail lets teams target the right measure at each store, from shrink strategy to guard modeling, before losses accumulate.
Operational Improvements
Traditional fleet risk scoring often relies on a single legacy crime score that is inconsistent across regions and offers no detail beneath the number. Base Operations transforms this approach by providing:
- One consistent Base Score for every store, at a defined radius
- Crime subcategory scores that reveal what a composite score hides
- API delivery that a single script can run across thousands of locations
- Output that maps as a native layer in the GIS tools teams already use
Use Case Walkthrough
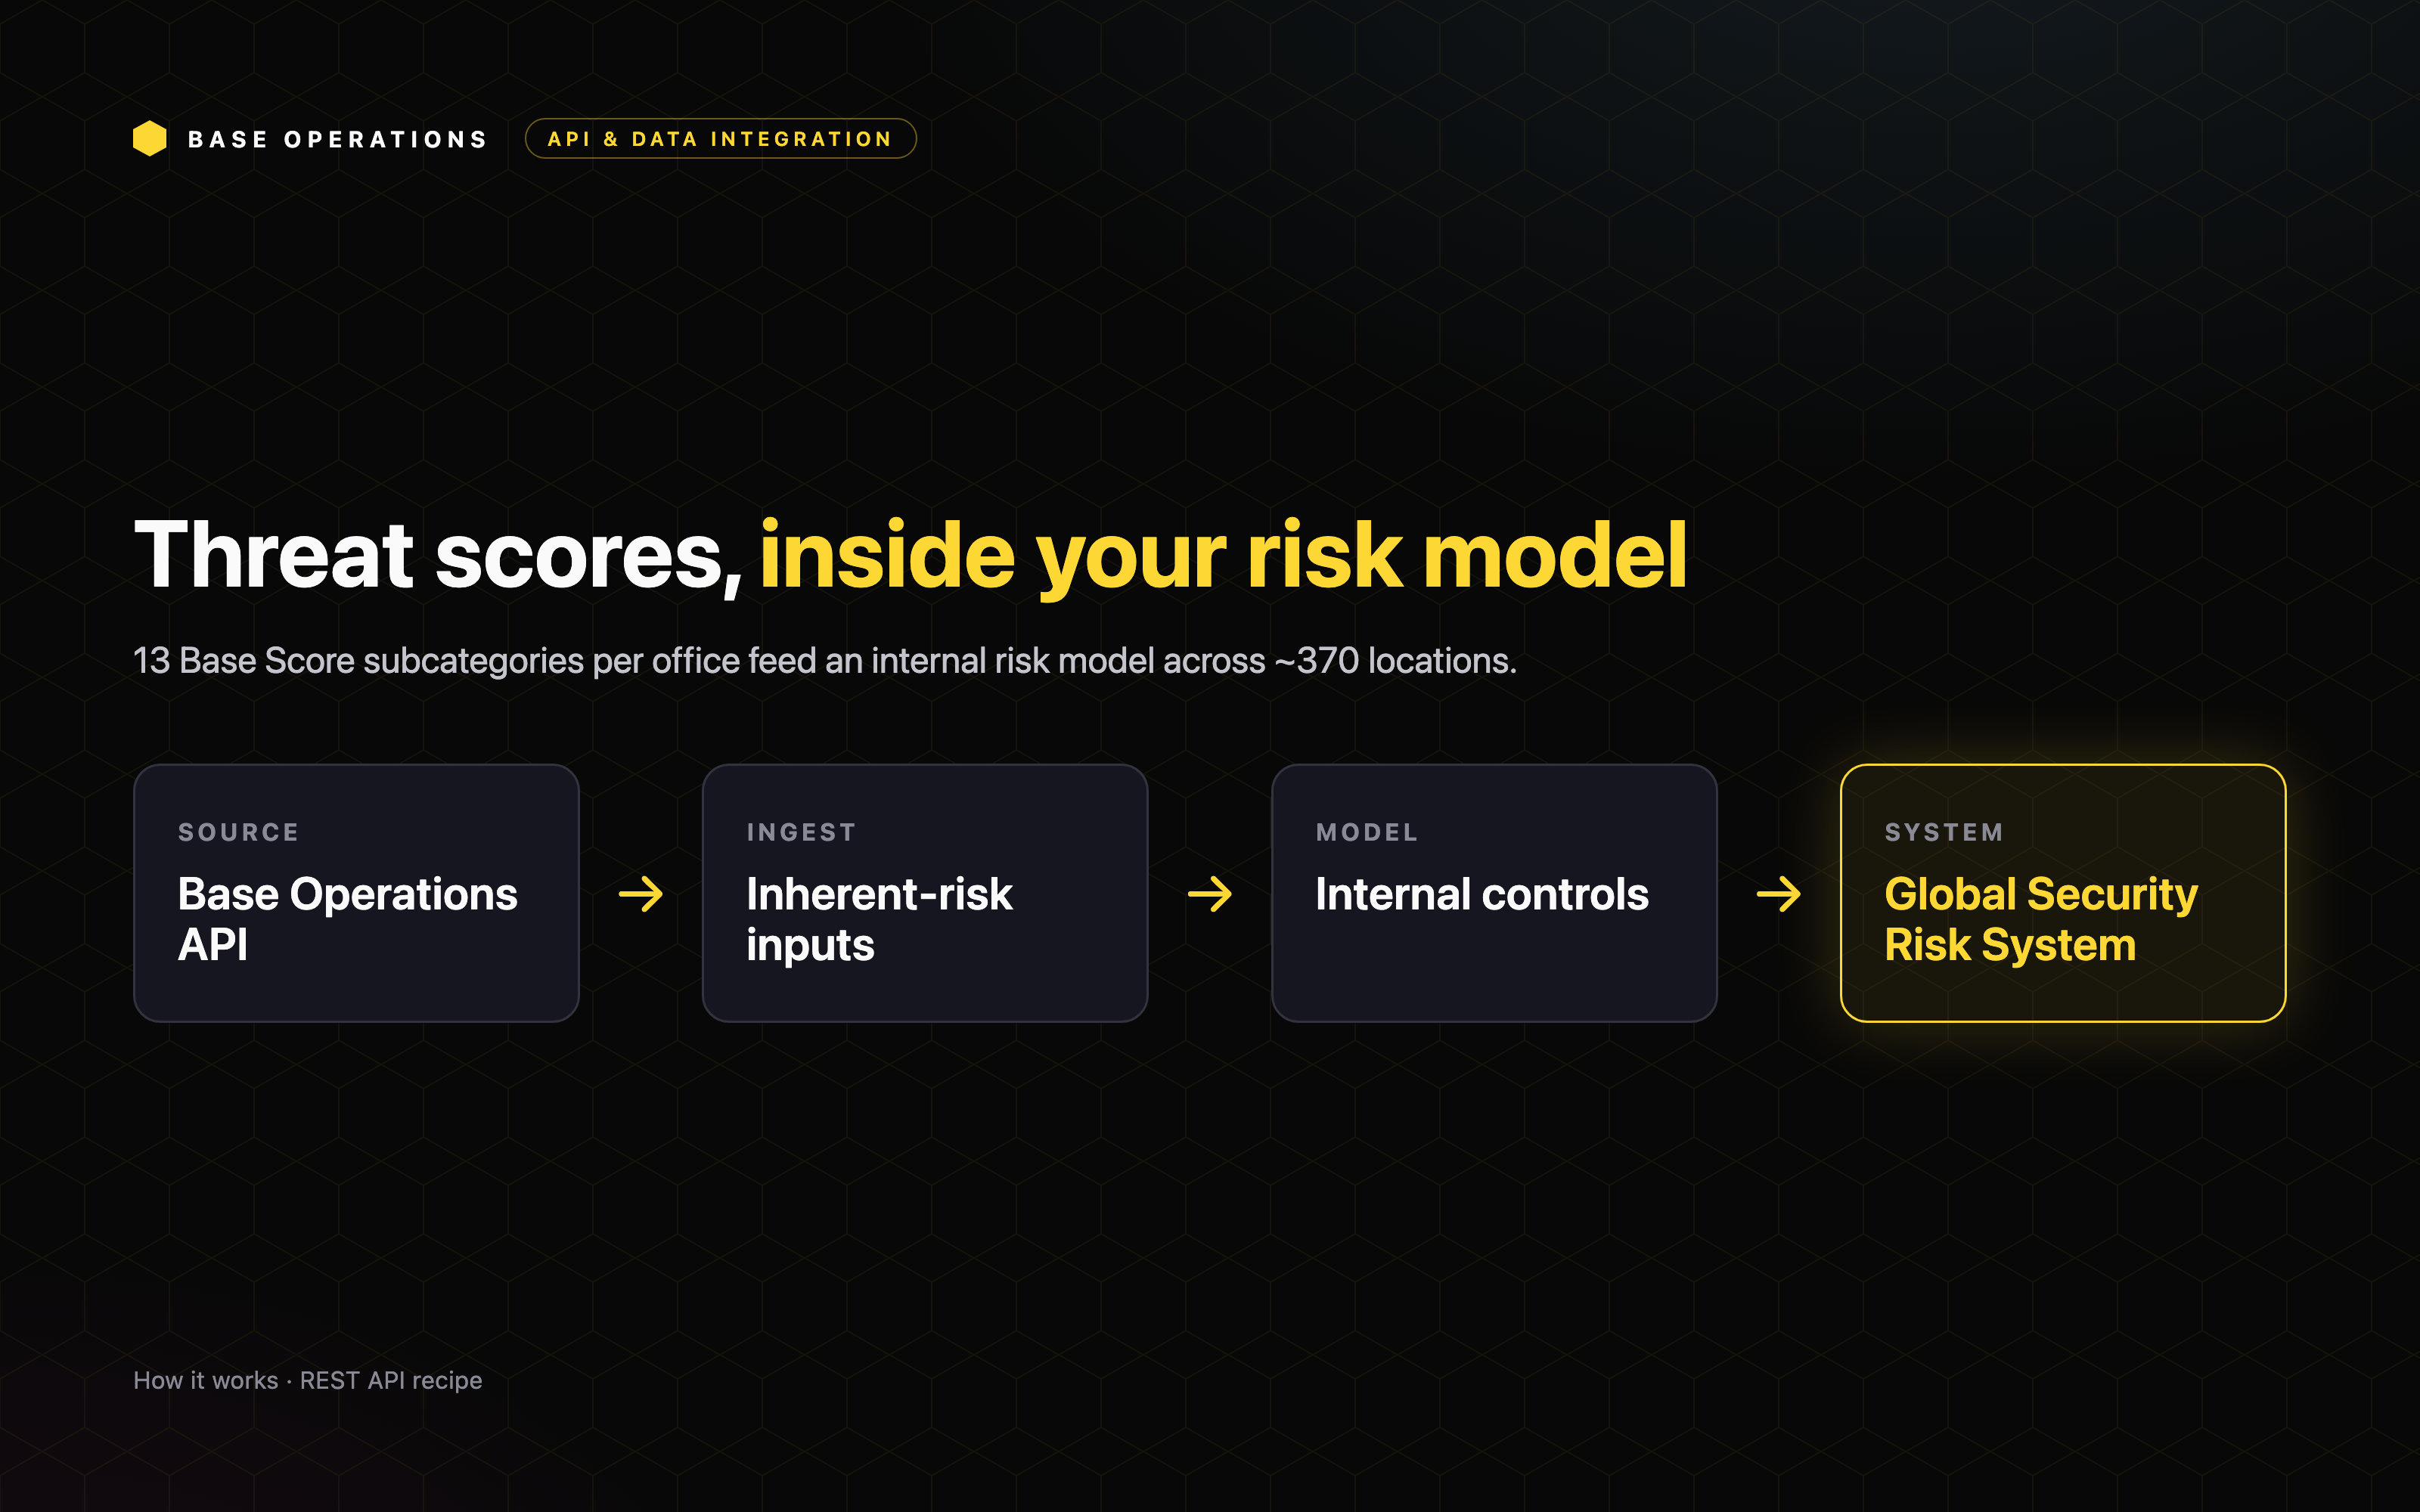
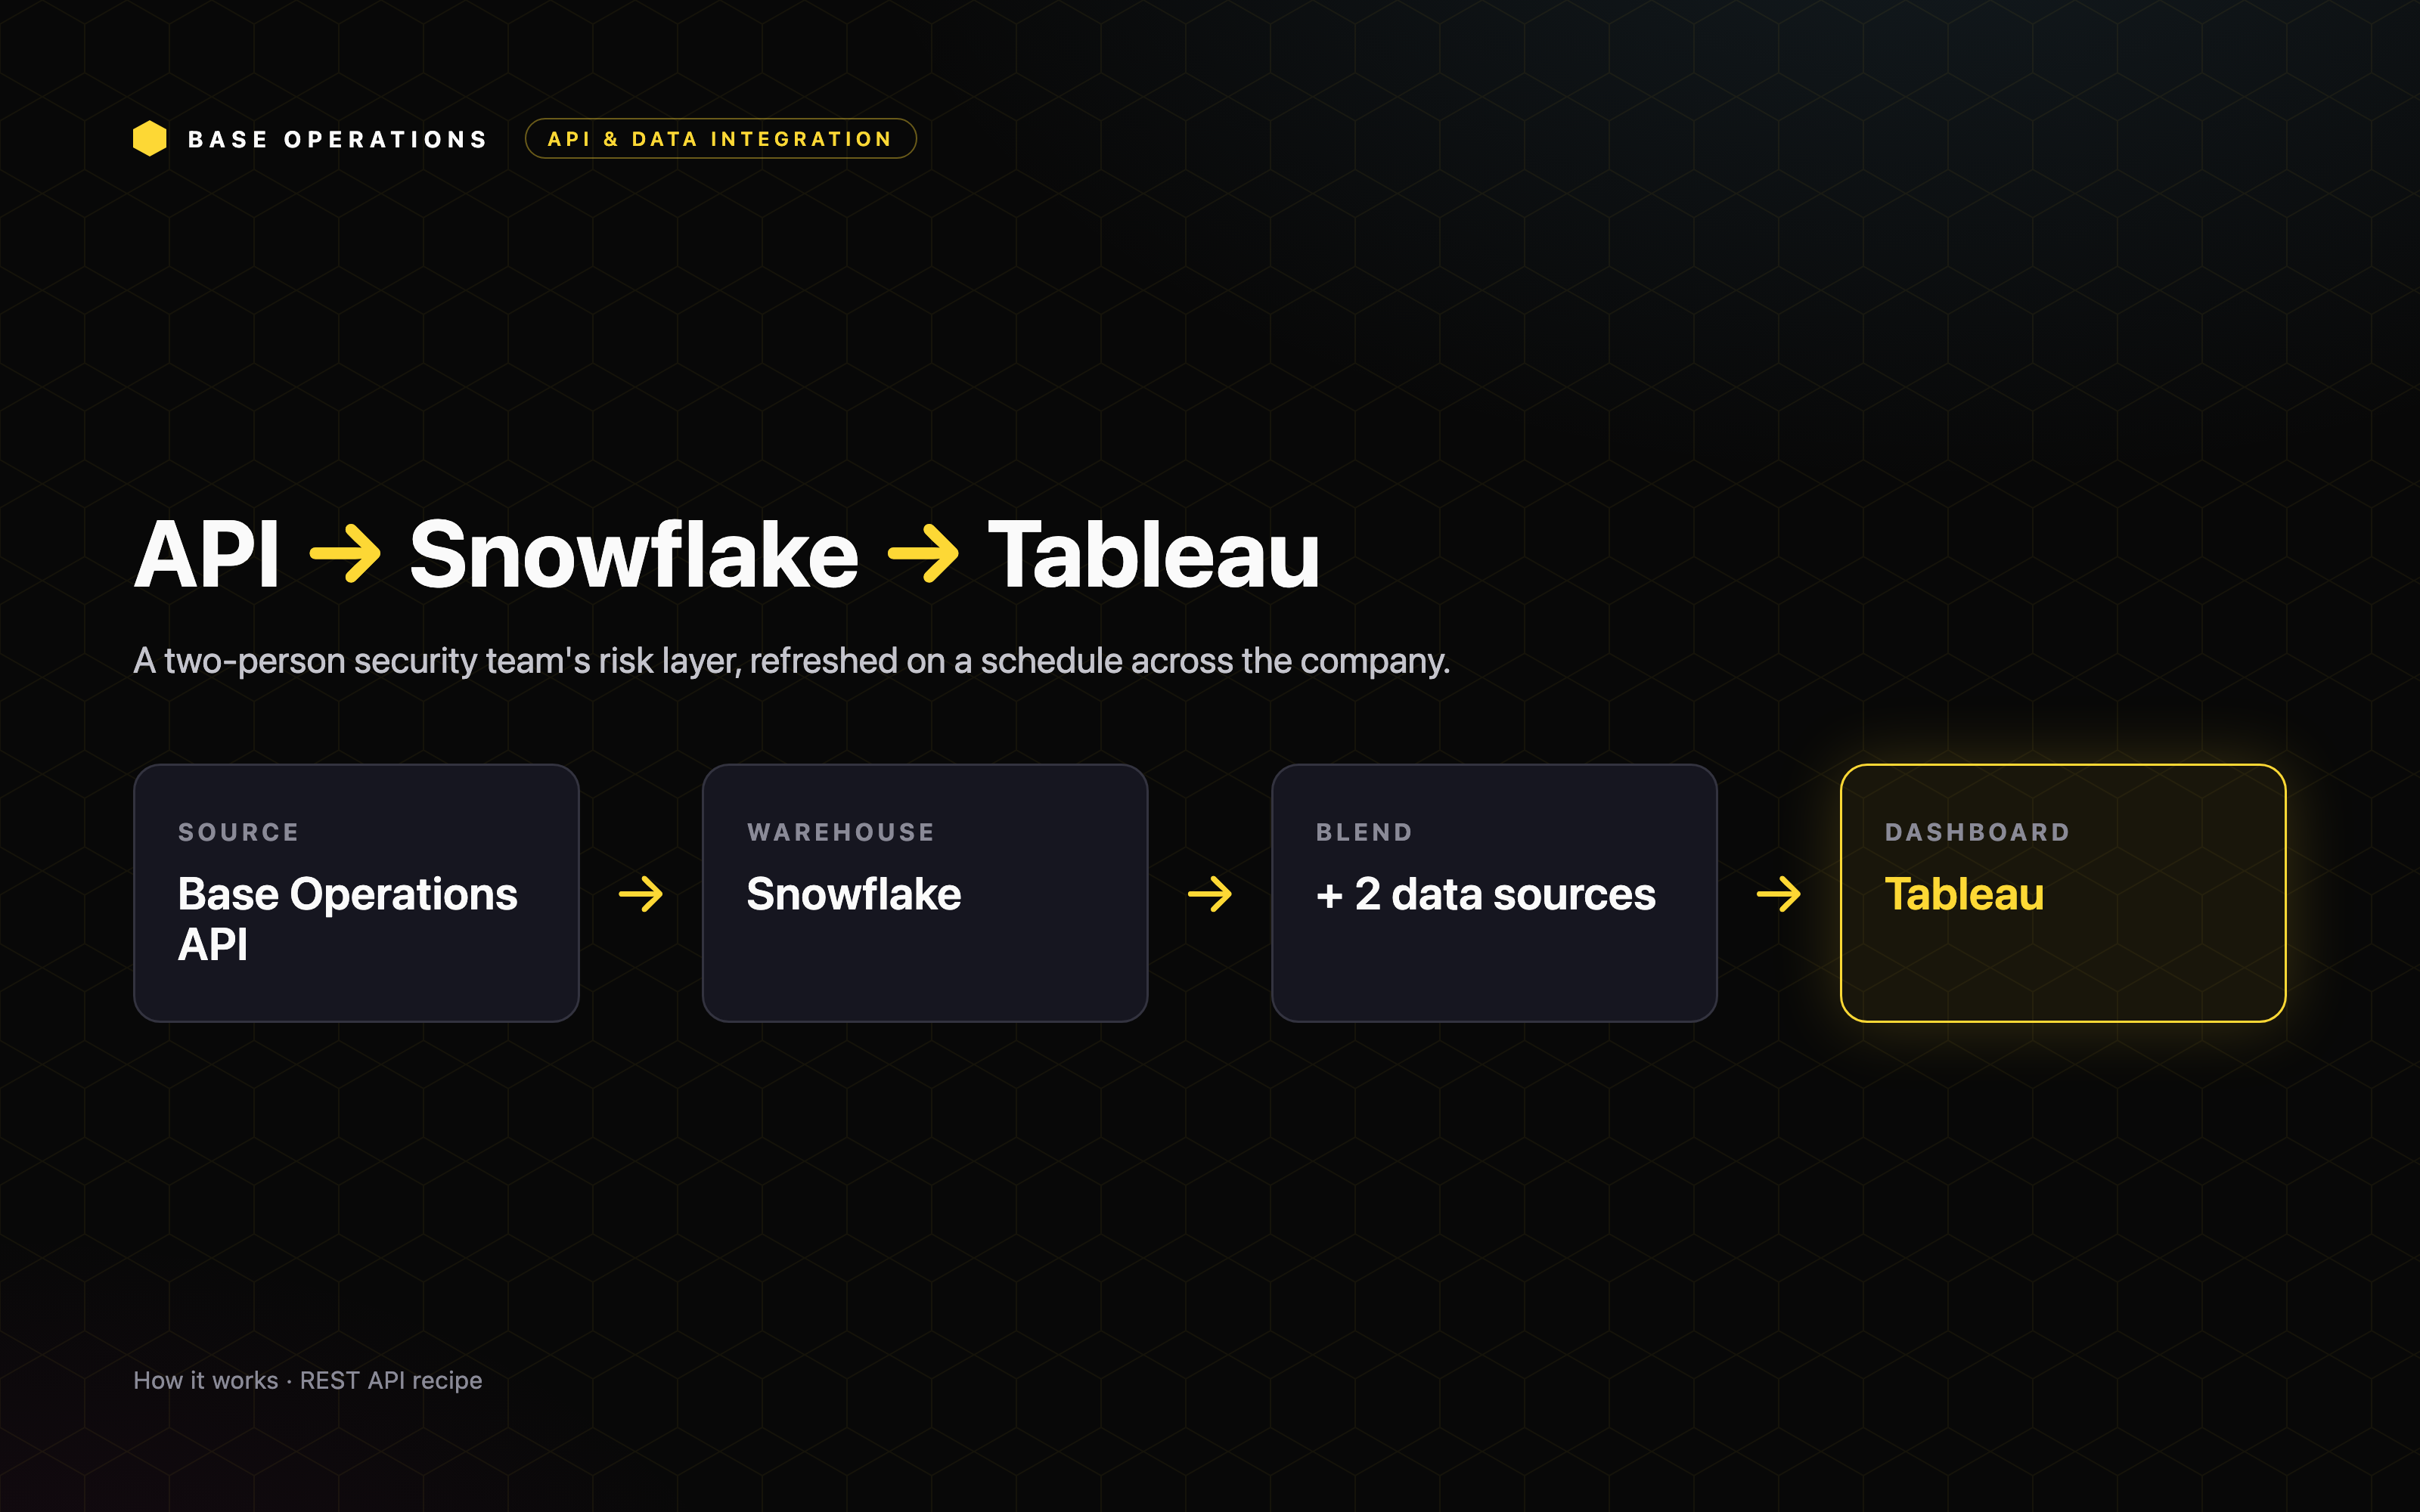
At fleet scale, the recipe is a loop. The script walks every store's coordinates, asks the API for a score and subcategory breakdown, and writes back a risk classification that ArcGIS can render as a map layer.
Step 1: Iterate every store
A Python script steps through all ~9,200 store locations by latitude and longitude.
Step 2: Score each location
For each store, the API returns a Base Score and subcategory scores at a half-mile radius, the standard the retailer confirmed for store-level risk classification.
Step 3: Classify the risk
Each store gets a risk class derived from its score and subcategory profile.
Step 4: Map it in GIS
The output surfaces as a native layer in Esri ArcGIS Enterprise. The GIS team and the site-selection team both read from it.
The endpoints behind it
What comes back
The composite Base Score classifies the store, and the subcategory scores explain it. This store's composite is a low 15, yet its Vandalism subcategory scores 83. That gap is invisible in the composite and decisive for operations, and it is exactly what drives shrink strategy and guard modeling.
Conclusion
Crime subcategory scores drive decisions about new-store viability, shrink risk, and security-infrastructure investment at fleet scale, because they reveal the specific threats a composite score hides. A single scheduled script turns 9,200 addresses into a live, queryable risk layer inside the tools the retailer's teams already use every day.
This is the shift from reactive to proactive. Every store carries a current, detailed risk score in the same map teams already work from, so decisions about people, assets, and investment start from evidence.